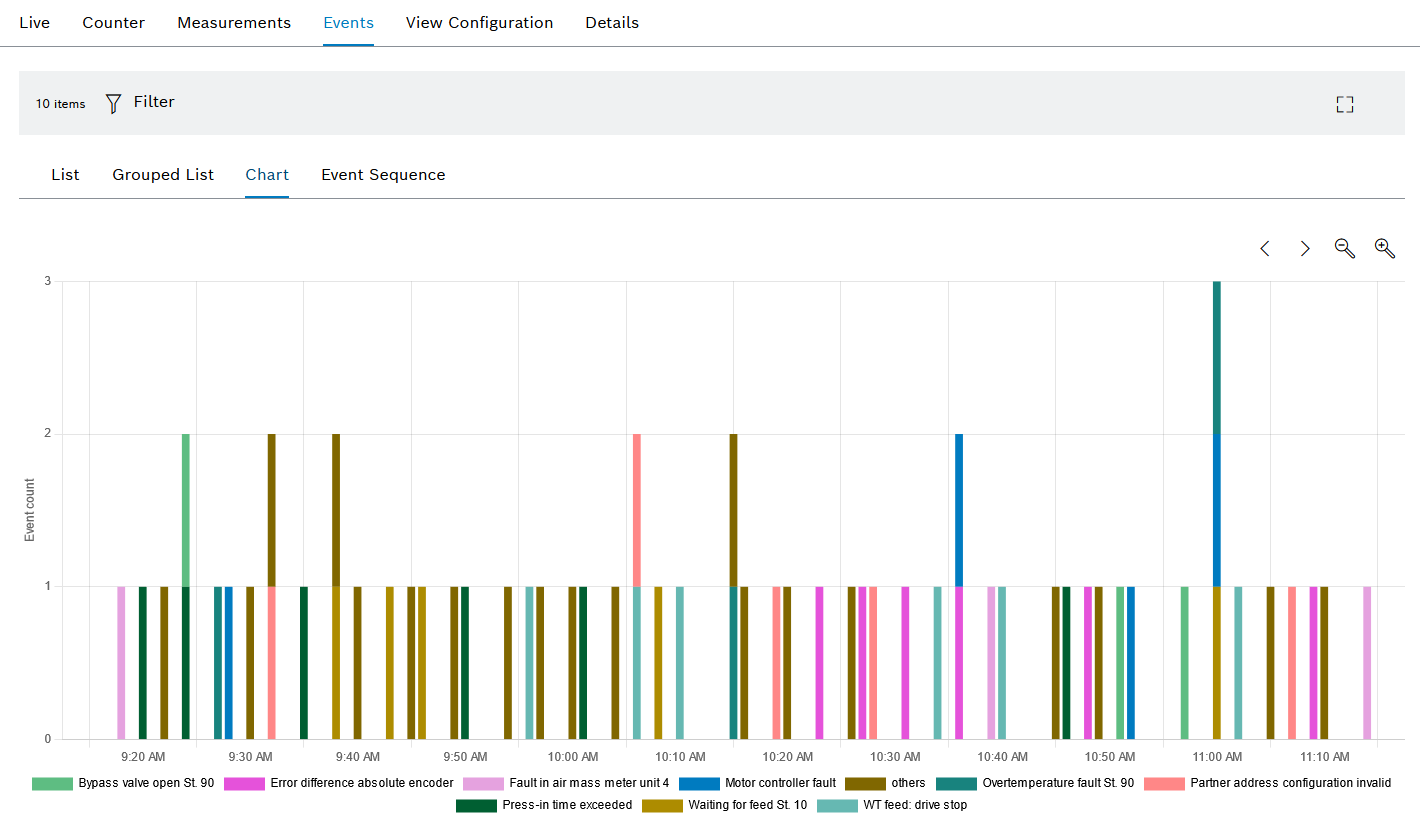
If a device is selected in the Efficiency analysis > Condition monitoring menu, the detailed view opens. Device events (machine messages, rule results, technical information) are displayed in a graphical view in the Graphics tab under the Events tab in the detailed view.
Element/icon/column |
Description |
|---|---|
XX entries |
Number of events |
|
Filter the overview by selecting Time Range, Event Code, Severity and Title in the dialog window. |
|
Open full-screen mode. The full-screen mode can be closed with [ESC]. |
|
Navigate forward or back by half an hour. |
|
Zoom in and out. To select an area, draw a rectangle with the mouse. |