![]()
![]()
![]()
![]()
|
|
|
|
|
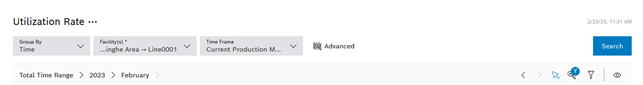
The following interaction elements are available:
Prerequisite
KPI Reporting User or KPI Reporting Administrator role
Element/icon |
Description |
|---|---|
|
Select a report from the drop-down list |
Report |
Select further reports, Pareto charts or the grouping from the drop-down list |
Facility(s) |
Select one or more facilities for which a report is to be displayed from the drop-down list. |
|
Select the desired time range in the calendar |
|
|
Search |
Searches for the data according to the input |
|
Adjust the time range in the breadcrumbs using or Changing the time range (year, month, day) also changes the time grouping within the diagram. Click Total Time Range to reset the time filter. |
|
The calendar view changes to the previous or next day/month/year. The view cannot be moved to the future. |
|
The tool tips displayed in a diagram can be shown or hidden. The diagram tooltips are shown by default. |
|
|
|
Different diagram options are available for the reports. These are described in the chapters of the respective reports. |
|
|
CSV Export |
Exports the entries in the Table and Raw data display modes for further processing. |
The various report groups summarize the individual reports thematically.
The availability of the Diagram, Table and Details display modes is individual for each report.