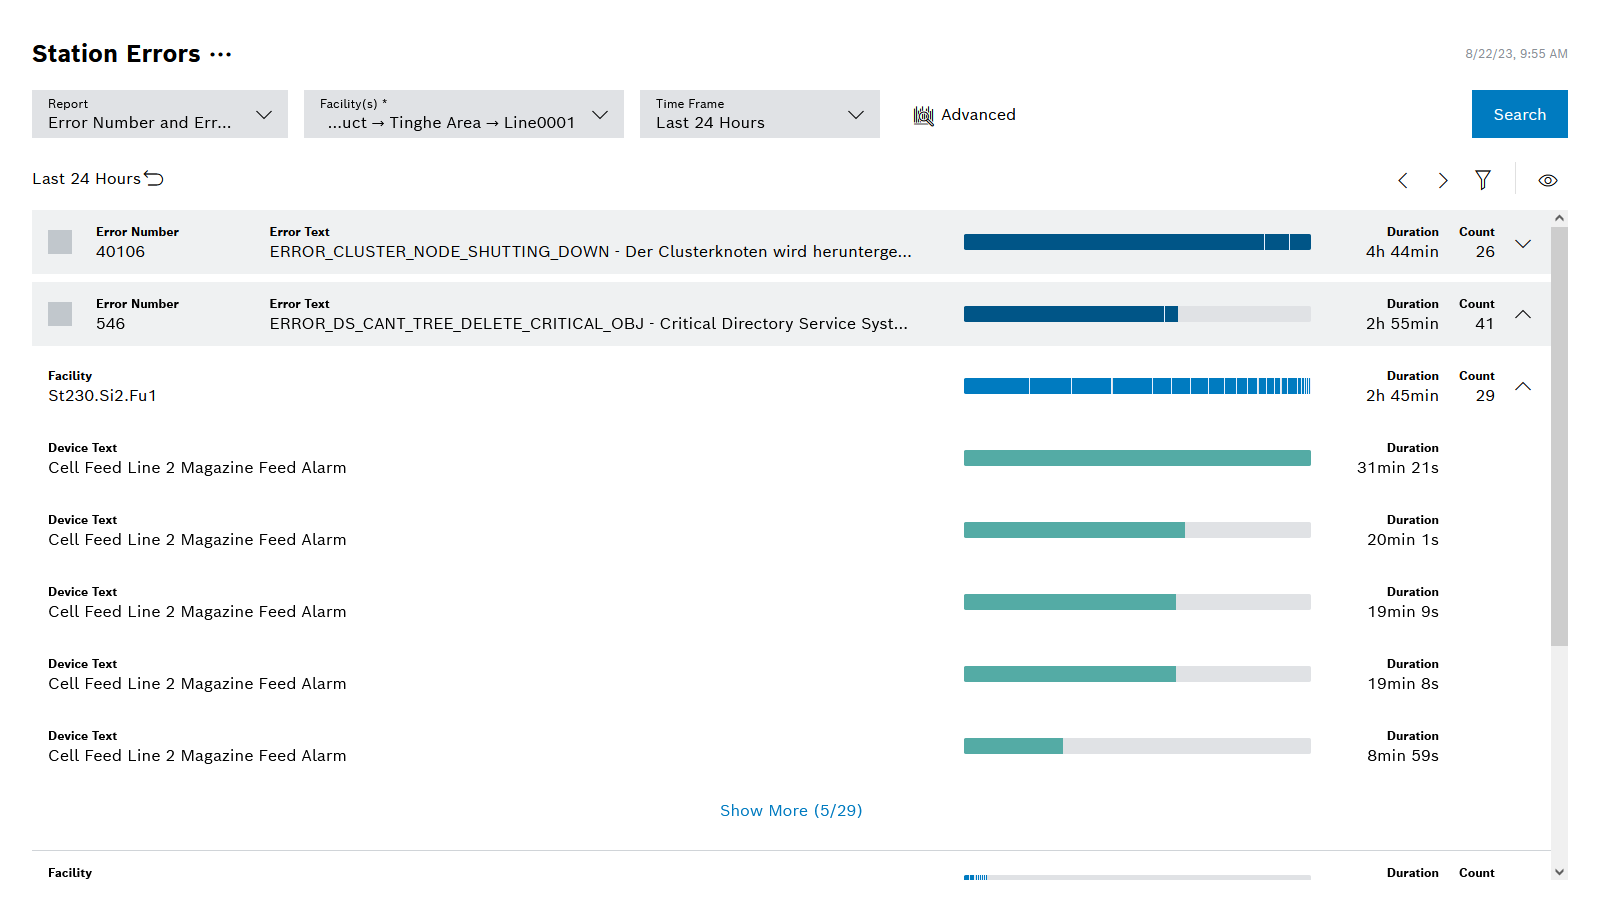
The Error Numbers and Pareto Text report shows station errors in the form of a Pareto chart.
Element/icon |
Description |
|---|---|
Error Number |
ID of the station error that occurred |
Error Text |
Error text that was configured for this station error |
|
Displays more details about the station error The icon is displayed above any line when the mouse is moved over it. |
Duration/MTTR (bar) |
Average downtime, i.e. total downtime divided by the number of downtimes in the form of a bar |
Duration/MTTR |
Average downtime, i.e. total downtime divided by the number of downtimes |
Count |
Number of station errors that occurred |
Facility |
Facility at which this station error occurred. |
Device Text |
Optional, additional device error text for a station error |
Diagram options
Element |
Description |
Display |
Selection between Durations with overlaps and Summarized durations Durations with overlaps occur when more than one error occurs simultaneously at one or more facilities. |
Duration |
Display as a total or MTTR Only when selecting the Durations with overlaps display |
Number of Rows |
Number of rows added by clicking Show More. |
The bar chart scales separately at each level (different colors)
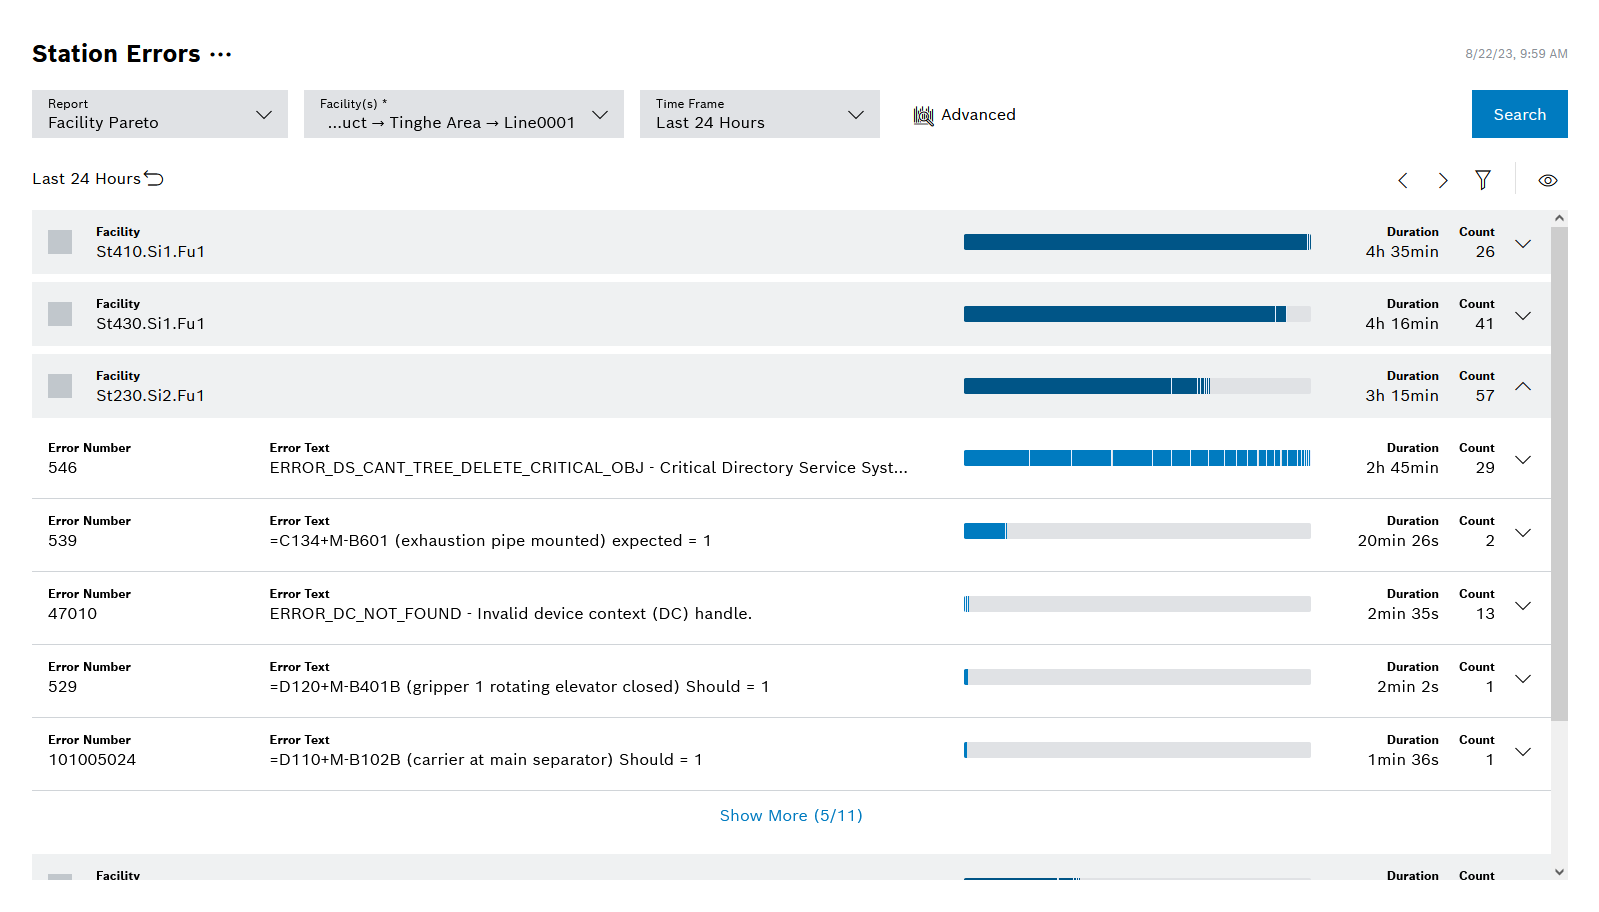
The Facilities Pareto report shows station errors over facilities in the form of a Pareto chart.
Element/icon |
Description |
|---|---|
Facility |
Facility at which this station error occurred. |
Error Number |
ID of the station error that occurred |
Error Text |
Error text that was configured for this station error |
|
Displays more details about the station error |
Duration/MTTR (bar) |
Average downtime, i.e. total downtime divided by the number of downtimes in the form of a bar |
Duration/MTTR |
Average downtime, i.e. total downtime divided by the number of downtimes |
Count |
Number of station errors that occurred |
Device Text |
Optional, additional device error text for a station error |
Diagram options
Element |
Description |
Display |
Selection between Durations with overlaps and Summarized durations Durations with overlaps occur when more than one error occurs simultaneously at one or more facilities. |
Duration |
Display as a total or MTTR Only when selecting the Durations with overlaps display |
Number of Rows |
Number of rows added by clicking Show More. |
The bar chart scales separately at each level (different colors)