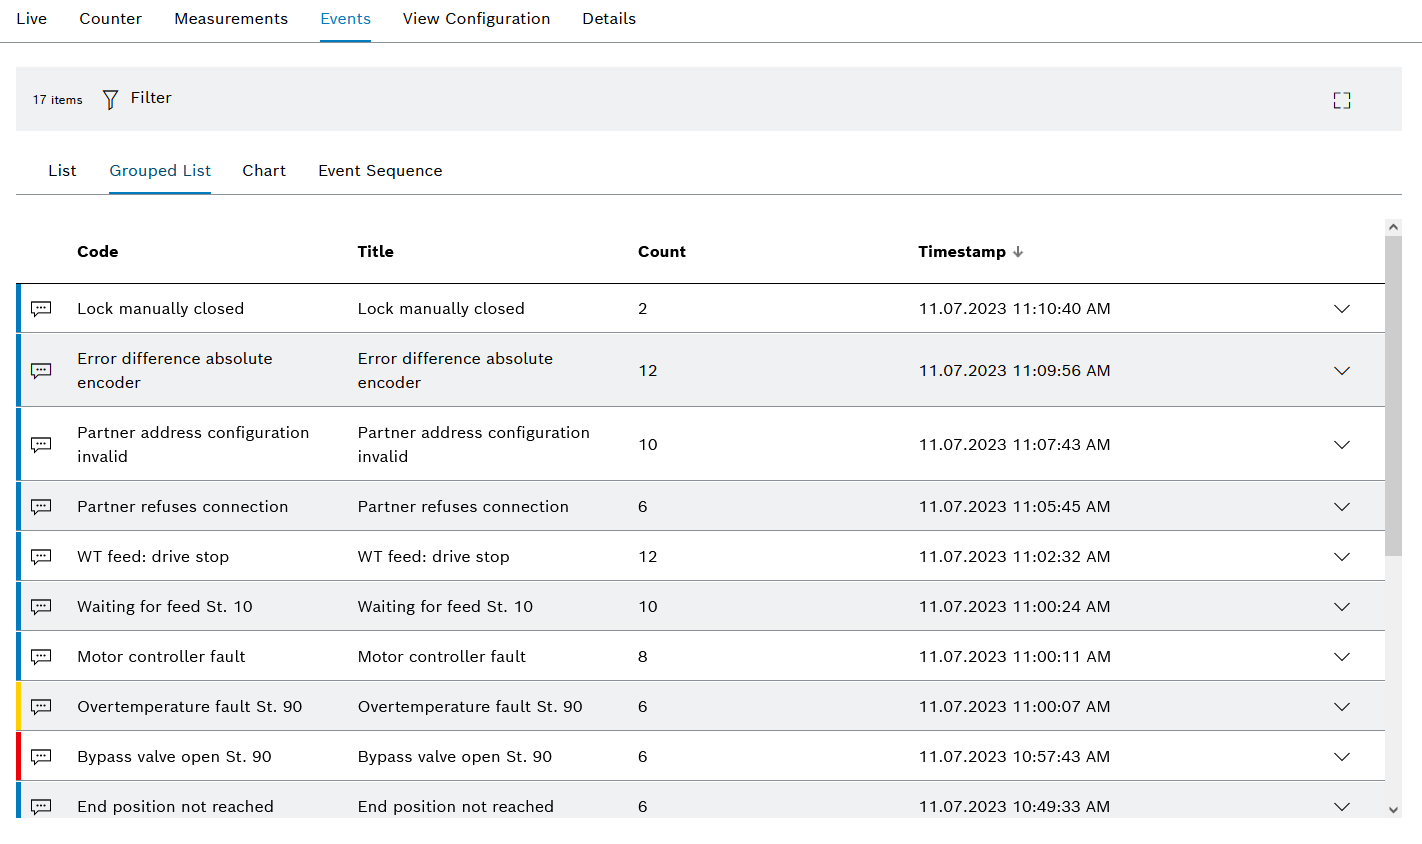
If a device is selected in the Efficiency analysis > Condition monitoring menu, the detailed view opens. Machine messages, technical information and rule events of the device are displayed in a table grouped by priority, code, title and number of events in the detailed view under the Events tab in the Grouped List sub-tab.
Element/icon/column |
Description |
|---|---|
XX entries |
Number of events
|
|
Filter the overview by selecting Time Range, Event Code, Severity and Title in the dialog window. |
|
Open full-screen mode. The full-screen mode can be closed with [ESC]. |
Code |
Code defined in the triggered rule or code of the machine message |
Title |
Description of the triggered rule or of the machine message |
Count |
Number of times the event occurred |
Time |
Time when the event last occurred |
|
Expand and collapse all details of the event. |