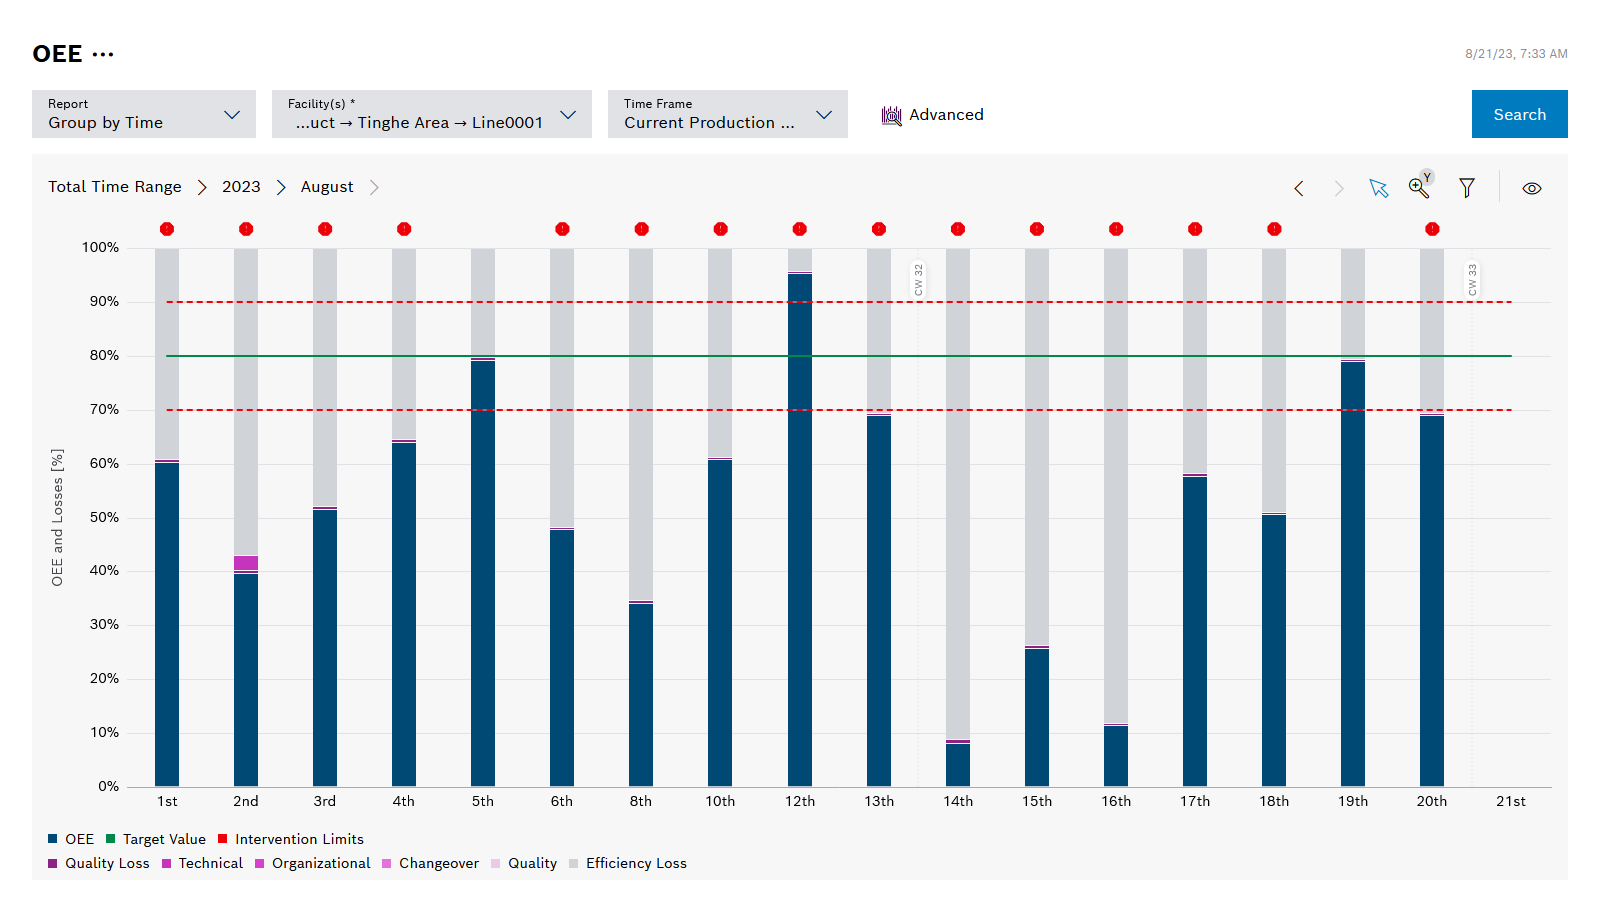
The OEE report shows OEE and losses across time and facility.

Legend
Click on the elements in the legend to show or hide them. Hidden elements are grayed out in the legend and the preceding icon is rotated.
Element |
Description |
|---|---|
OEE |
Overall equipment effectiveness of one or more facilities |
Target Value |
OEE to be achieved |
Intervention Limits |
Validity range for the setpoint. Action is required if the upper intervention limit is exceeded or the lower intervention limit is undershot. If this is the case for the selected past period, |
Quality Loss |
Part count losses, such as NOK parts, scrapped parts and rework. |
Technical |
Availability losses, for example due to a mechanical fault |
Organizational |
Availability losses, for example due to lack of workers |
Changeover |
Availability losses, for example due to changeover processes |
Quality |
Availability losses, for example due to defective additional components |
Efficiency Loss |
Remaining losses, for example due to minor faults or cycle time extension |
Diagram options
Element/icon |
Description |
|---|---|
Display format |
Select between percentage or parts |
Split Days Into Shifts |
When activated, the OEE and losses per shift are displayed. Only when selecting the Grouping by time report and only when grouping by day (e.g. one month as the time range). |
High contrast |
Displays the availability loss categories in high-contrast colors |