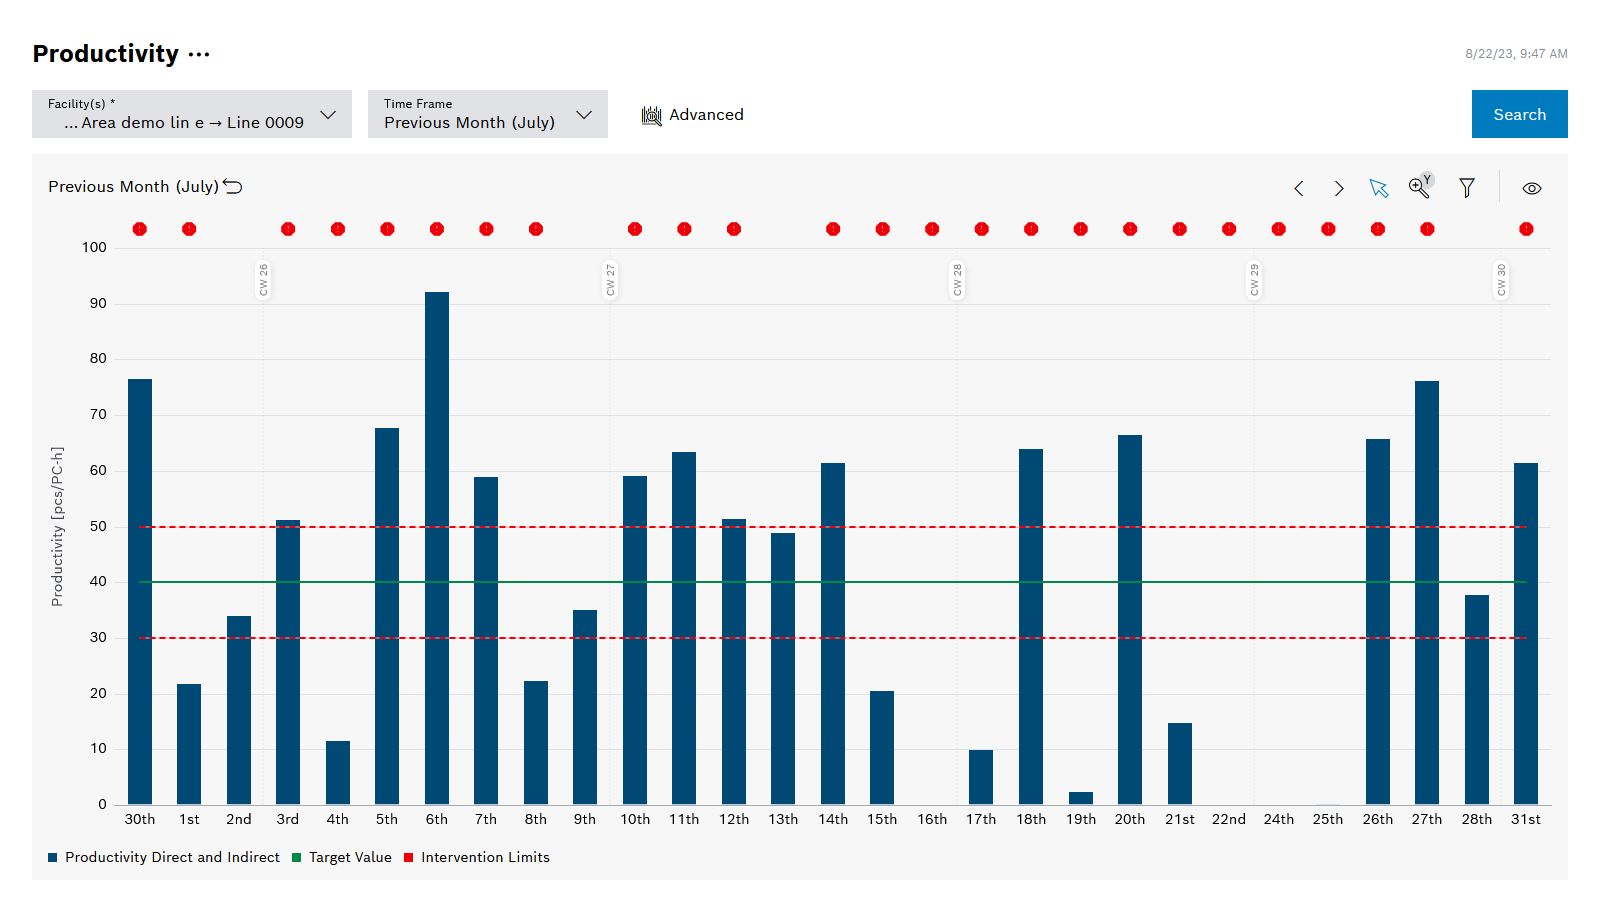
The Productivity report shows the productivity trend over time. The productivity is calculated from the ratio of the number of good parts and the number of worker hours.
Legend
Click on the elements in the legend to show or hide them. Hidden elements are grayed out in the legend and the preceding icon is rotated.
Element |
Description |
|---|---|
Productivity Direct and Indirect |
Productivity trend over time |
Target Value |
Productivity to be achieved |
Intervention Limits |
Validity range for the setpoint. Action must be taken if the validity range is undershot or exceeded. If this is the case for the selected past period, |
Diagram options
Element |
Description |
|---|---|
Display |
Productivity based on:
|
Split Days Into Shifts |
When activated, the productivity per shift is displayed. Only when selecting the Grouping by time report and only when grouping by day (e.g. one month as the time range). |