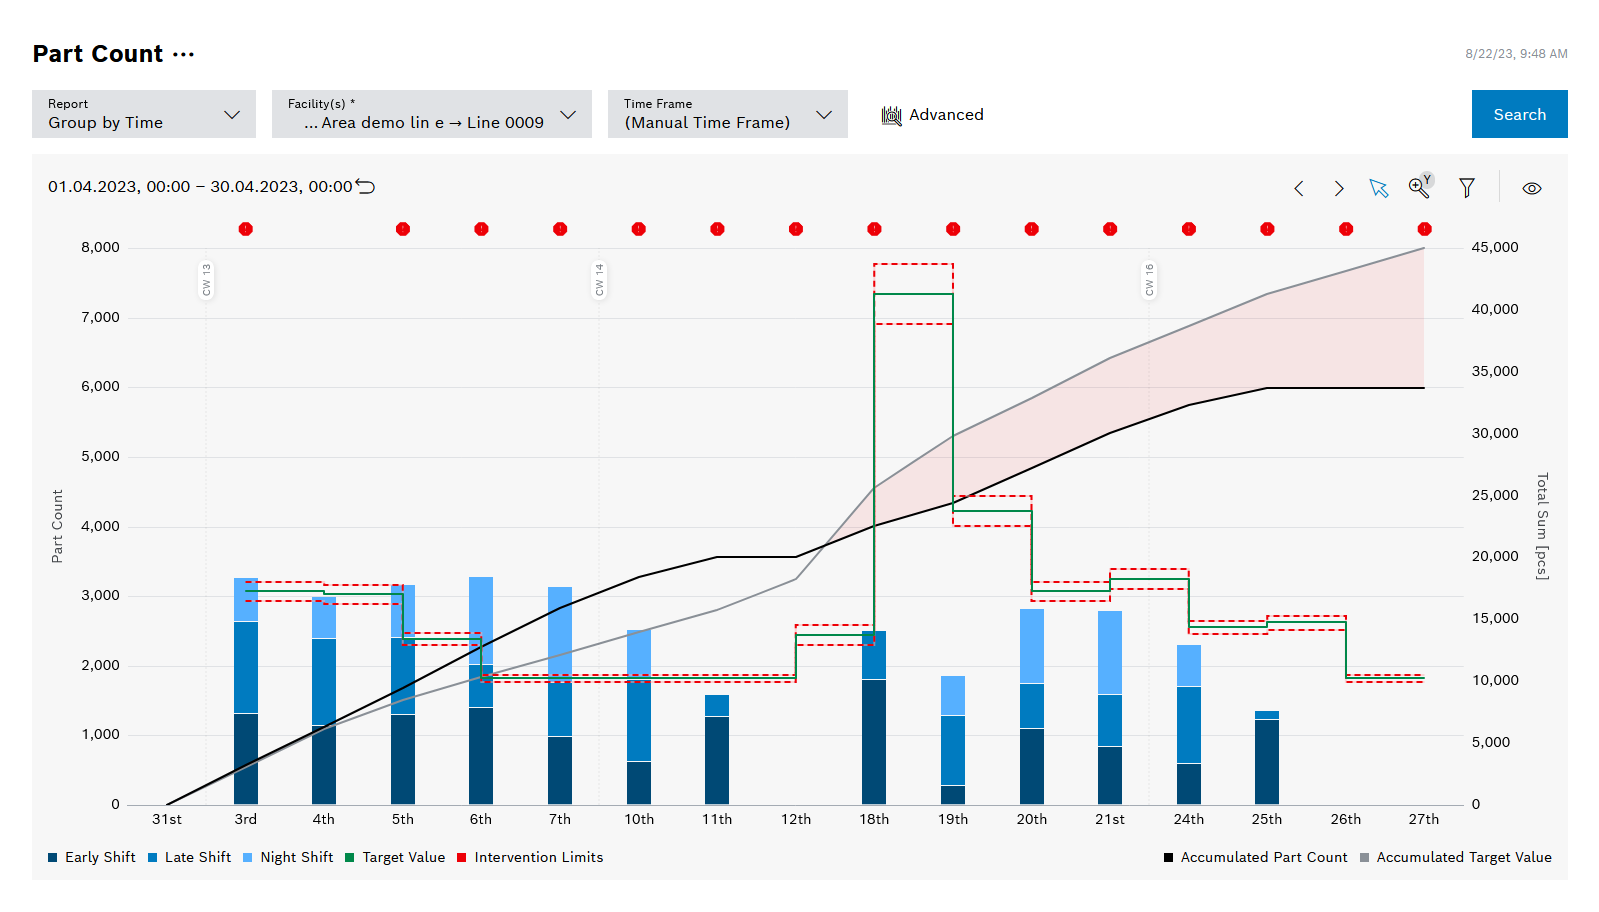
The Part Count report shows the part count produced per production day, month or year.
Legend
Click on the elements in the legend to show or hide them. Hidden elements are grayed out in the legend and the preceding icon is rotated.
Element |
Description |
|---|---|
Early Shift |
Display of part counts/quality losses produced in the early shift |
Late Shift |
Display of part counts/quality losses produced in the late shift |
Night Shift |
Display of part counts/quality losses produced in the night shift |
Target Value |
Part count to be achieved |
Intervention Limits |
Validity range for the setpoint. Action must be taken if the validity range is undershot or exceeded. If this is the case for past days, |
Accumulated Part Count |
Total of produced part counts |
Accumulated Target Value |
Cumulative setpoints |
Diagram options
Element |
Description |
|---|---|
Part Count |
Selection for displaying part counts or loss processes. |
Highlight Negative Cumulative Difference |
Highlight negative values in a red area if the cumulative actual part count is less than the target part count Only when selecting the Grouping by time report. |
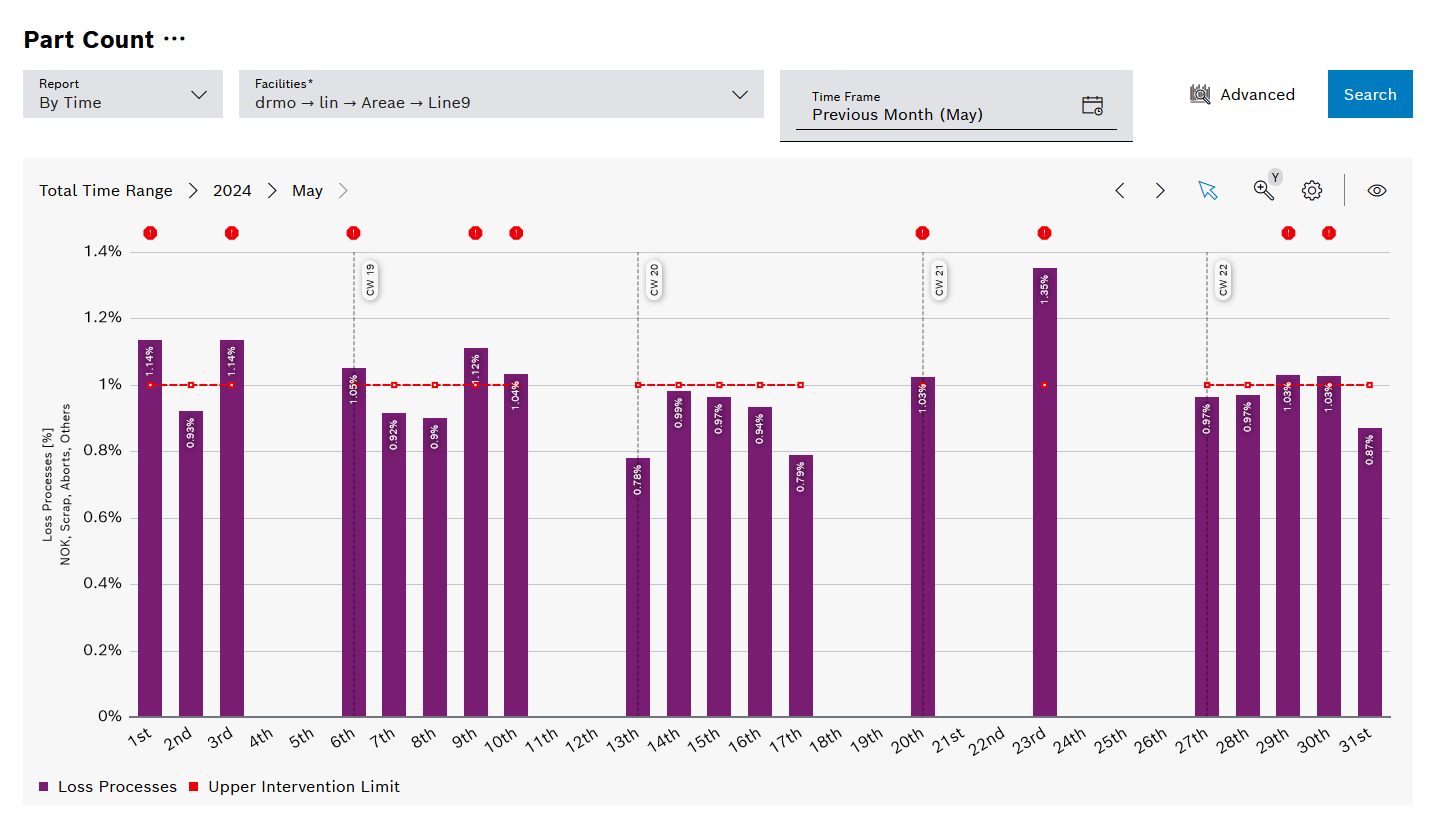
The Loss processes diagram shows process runs that have not been reported as "OK".
To display the Loss processes diagram, click on the Loss processes radio button in the diagram options of the Part count report.
Legend
Click on the elements in the legend to show or hide them. Hidden elements are grayed out in the legend and the preceding icon is rotated.
Element |
Description |
|---|---|
Loss processes |
Display of losses incurred |
Upper intervention limit |
Upper validity range of the setpoint |
Diagram options
Element |
Description |
|---|---|
Loss processes |
Selection for displaying loss processes or part counts |
Display format |
Selection between absolute losses or relative losses in relation to all process runs |
Visible Losses |
Shows NOK, scrap, abort and other process runs |
Split Days Into Shifts |
When activated, display of loss processes per shift Only with Display format = Relative or when selecting the Grouping by time report, and only when grouping by day (e.g. one month as the time range) |
Auto-Scale Y-Axis |
Automatic scaling of the loss processes to the maximum value Only with Display format = Relative |