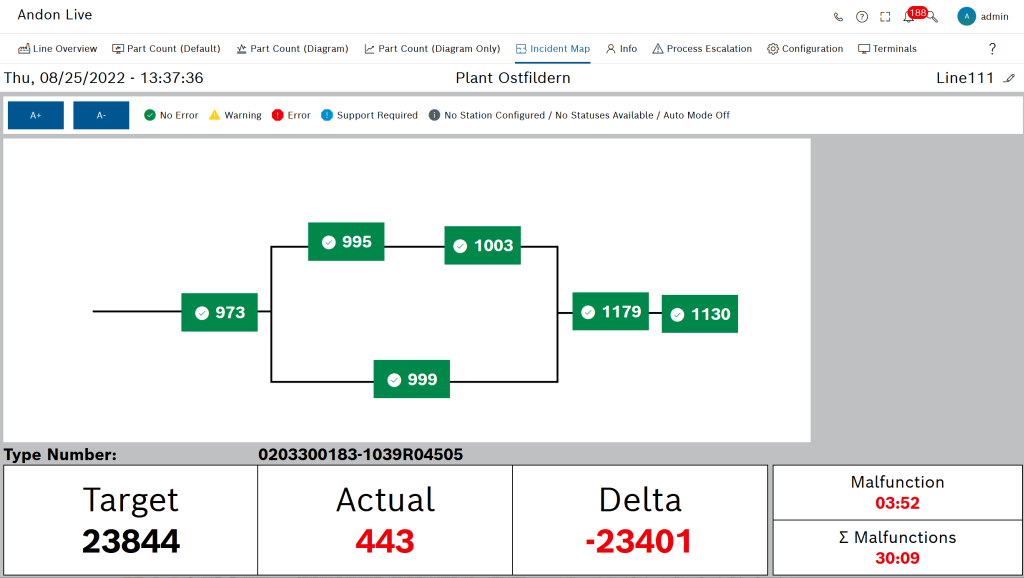
The Incident Map view shows the status of individual stations on a production line.
For each line, one image (e.g. the floor plan of a production line) can be saved and have stations assigned to it, and the display area for the production data can be configured: Configure Incident Map. The associated stations are displayed in the view colored according to their current status.
Header
Element/icon |
Description |
|---|---|
Date - Time |
Current date and time. |
Ostfildern plant |
Title message: Add, edit terminal |
Line 111 |
Current production line |
|
Select production line |
|
Show/hide legend |
Legend
Element/icon |
Description |
|---|---|
|
Control elements for enlarging/reducing the text in the station areas. |
|
Color coding for station areas |
Overview
Element/icon |
Description |
|---|---|
Line layout |
Shows the configured background image and color-coded station areas. |
Production data |
Line details display area: Type number; target, actual and delta part counts; and the most recent and total fault time. |