The Process Escalation view visualizes the frequency of process errors (NOK bits) that occur per station. If set limits are exceeded, a warning is issued. Warning limits and error limits, error patterns and error texts can be individually defined by means of a configurator: Configure Process Escalation view. The process errors are counted on a rolling basis over a configurable period (e.g. the last 8 hours or counted retrospectively over the last 2000 parts). Shift-free times are ignored.
Header
Element/icon |
Description |
|---|---|
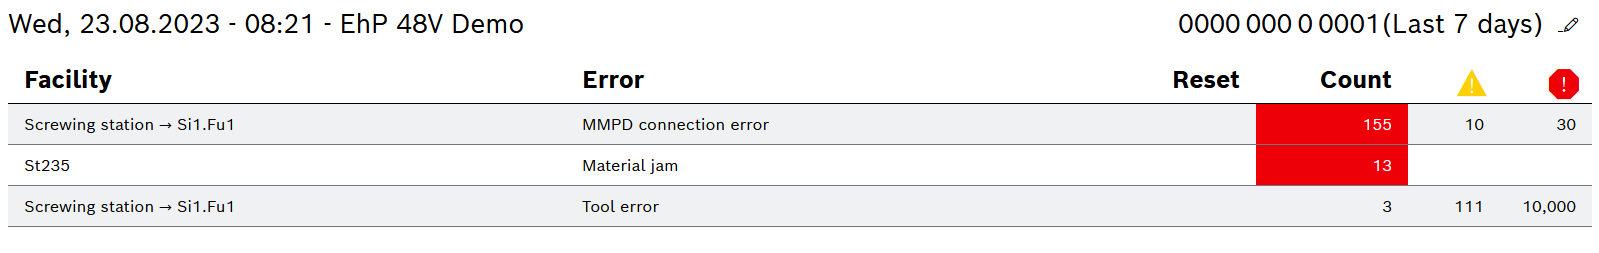
Thu 18.08.2022 - 10:27:20 |
Current date and time. |
Line: Line 1 (last 15 hours) |
Name of the selected line and the time period for which the error has been monitored (15 hours). |
Line 1 |
Current production line |
|
Select production line |
Dashboard
Element/icon |
Description |
|---|---|
Facility |
Name of the affected facility |
Error |
Error description |
Reset |
Reset time (reset x minutes or hours ago). The column can be shown/hidden: Configure general settings |
Count |
Number of errors since the last reset. Total number of errors in brackets. |
|
Warning limit for the number of errors in the selected period. |
|
Alarm limit for the number of errors in the selected period. |