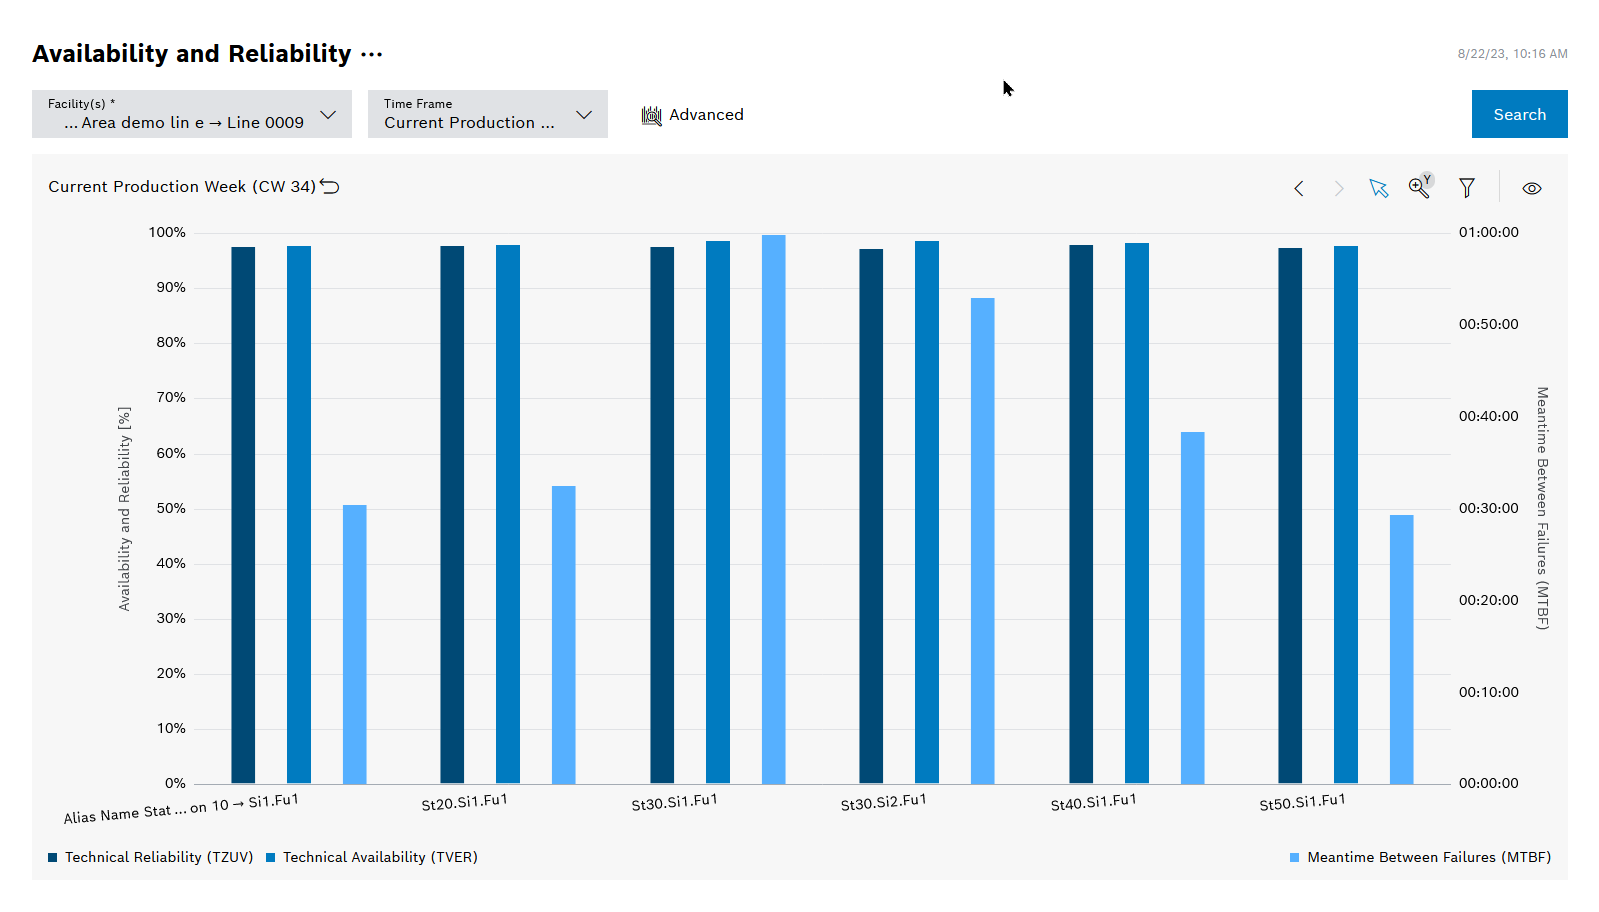
The Availability and Reliability report shows the technical availability, technical reliability and average operating time between failures.
Legend
Click on the elements in the legend to show or hide them. Hidden elements are grayed out in the legend and the preceding icon is rotated.
Element |
Description |
|---|---|
Technical Reliability (TZUV) |
Probability that a facility will operate correctly and free of failures. Does not take into account the impact of downtime after a fault occurs. |
Technical Availability (TVER) |
Probability of a facility being in a functional state at a given time. Takes into account the impact of downtime after a fault occurs. |
Mean Time Between Failures (MTBF) |
Average (mean) time between all failures over a selected time period. The lower this value, the lower the reliability, since the probability of failure occurring will be higher on average in between each failure. |
Diagram options
Element |
Description |
|---|---|
Display |
Selection between Topological chart and Pareto chart Topological Chart: Technical reliability and technical availability are sorted according to the order of the facilities. Pareto Chart: Technical reliability and technical availability are sorted by key performance indicators. |
Pareto Display |
Selection of:
Only available when the Pareto chart view is activated |