Multiple aggregations can be selected. If you select multiple aggregations, you can compare the different aggregations of the historical measured values.
- Count
Display all measured values in the specified time period.
- Maximum
Display the largest measured values in the specified time period.
- Average
Display the average measured values in the specified time period.
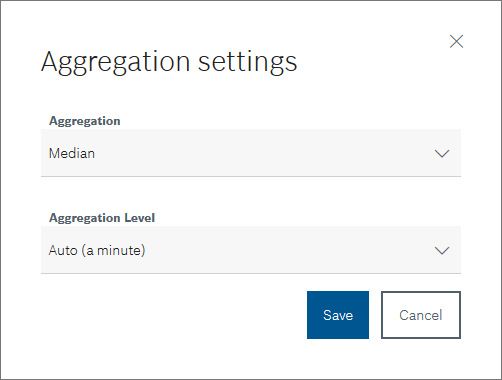
- Median
Display the median measured values in the specified time period.
- Minimum
Display the smallest measured values in the specified time period.
- Automatic (one minute)
Display one measurement per minute in the specified time period.
- Raw data (max. 10,000 measurement values)
Display raw data from the device within the specified time period.
- Decimated Raw Data (Max. 10,000 Measurement Values)
Display only every second measurement of the raw data of the device in the specified time period.
- One minute
Display one measurement per minute in the specified time period.
- 30 minutes
Display one measurement per 30 minutes in the specified time period.
- 1 hour
Display one measurement per hour in the specified time period.
- 12 hours
Display one measurement per 12 hours in the specified time period.
- 1 day
Display one measurement per 24 hours in the specified time period.
- 1 month
Display one measurement per 30 days in the specified time period.