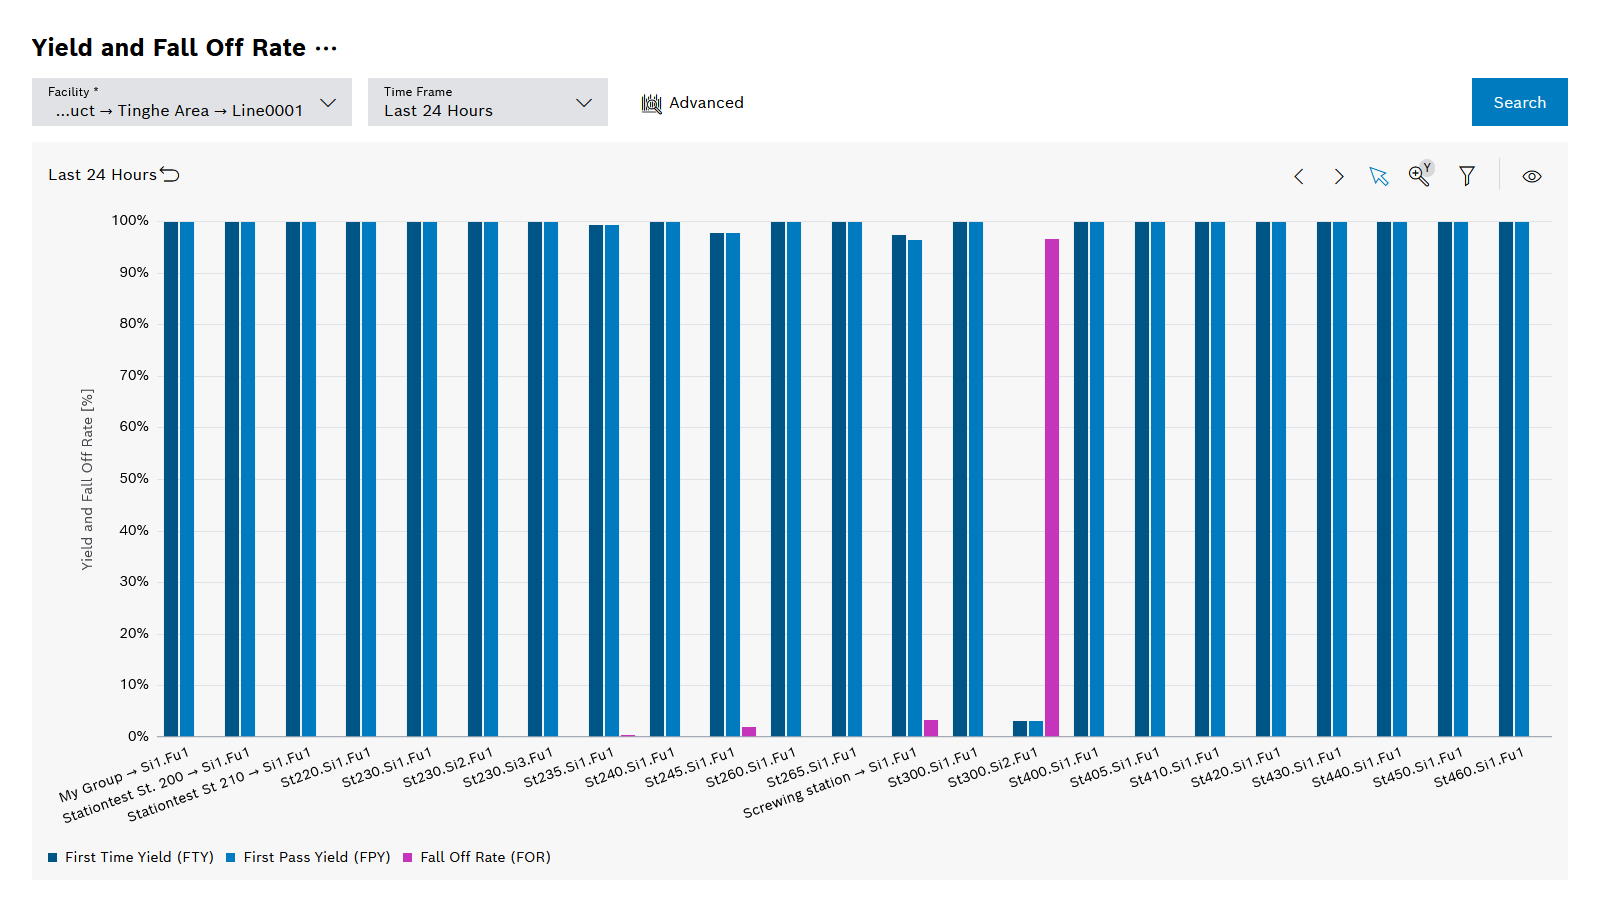
The Output and failure rate report shows an overview of the ratio of processes with good parts and parts that generate scrap.
Legend
Click on the elements in the legend to show or hide them. Hidden elements are grayed out in the legend and the preceding icon is rotated.
Element |
Description |
|---|---|
First Time Yield (FTY) |
Shows the ratio of processes with good parts to all processes |
First Pass Yield (FPY) |
Shows the ratio of processes with good parts without any reworking to all processes |
Fall Off Rate (FOR) |
Shows the parts that generate scrap the first time and require rework (100% — FPY) |
Diagram options
Element |
Description |
|---|---|
Display |
Selection between the topological chart and the Pareto chart Topological Chart: If activated, facilities are sorted according to their predecessor and successor relationships. Pareto Chart: In the Pareto view, the facilities are sorted in ascending order according to good output/first good output, and in descending order according to the failure rate. This means that the facility with the worst KPI is always displayed first. |
Pareto Display |
Select between first time yield, first pass yield and fall off rate Only when selecting the Pareto chart display |