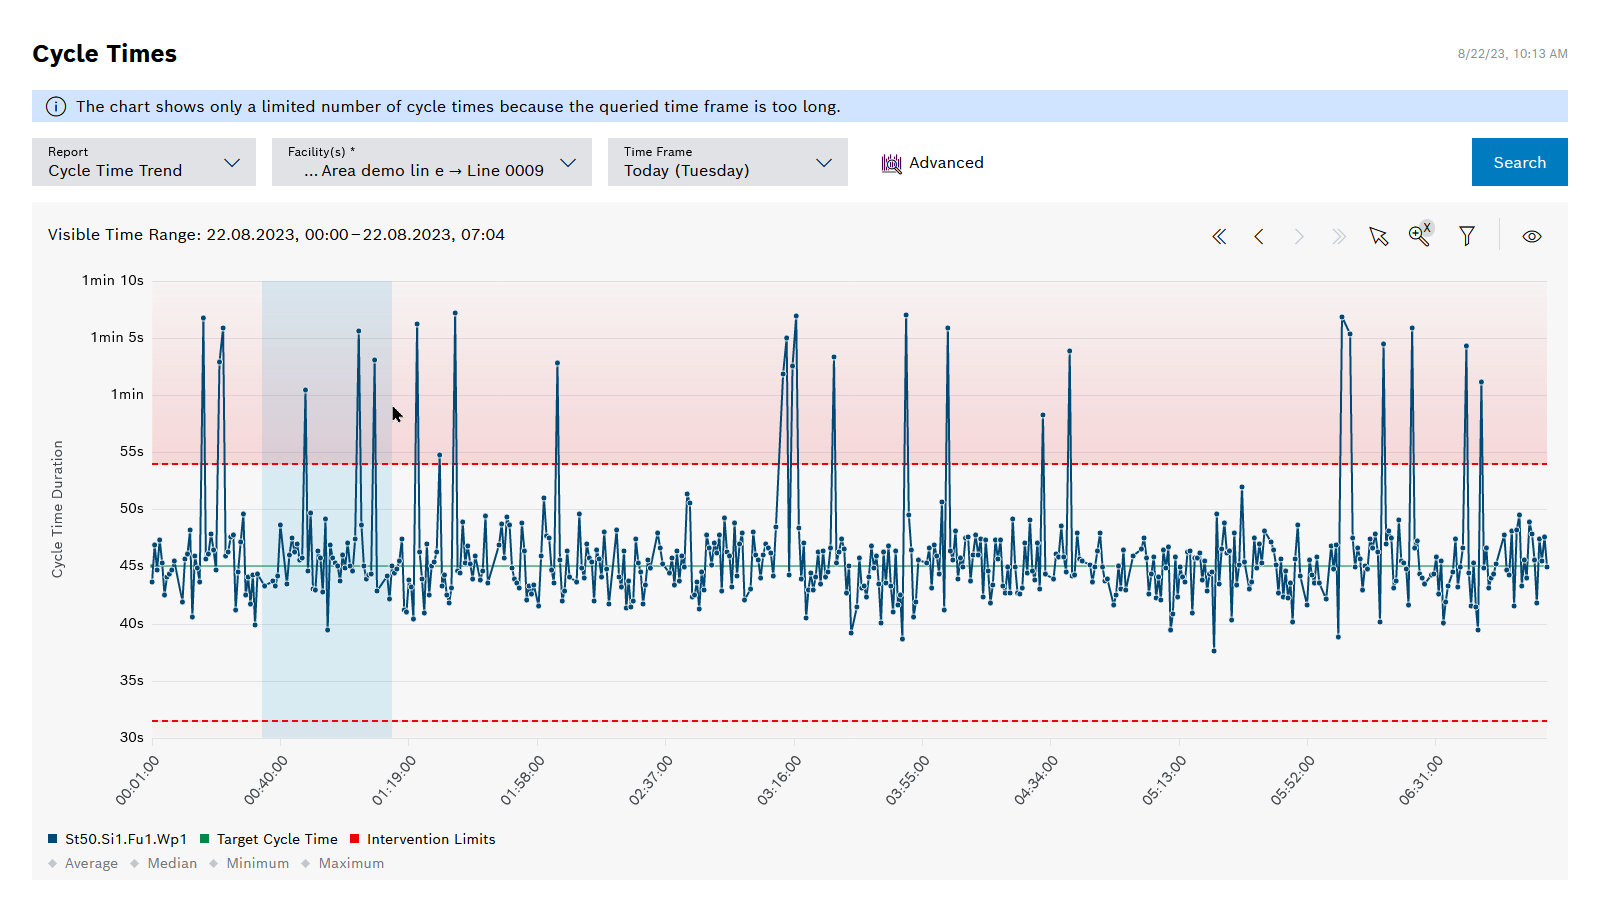
The Cycle Time Trend report displays the cycle times trend for a specific time period.
Legend
Click on the elements in the legend to show or hide them. Hidden elements are grayed out in the legend and the preceding icon is rotated.
Element |
Description |
|---|---|
Facility <xy> |
Facility selected from the Facility(s) drop-down list |
Target Cycle Time |
The cycle time to be achieved |
Intervention Limits |
Validity range for the setpoint. Action is required if the upper intervention limit is exceeded or the lower intervention limit is undershot. |
Average |
Arithmetic mean value of the cycle times per type |
Median |
Median cycle time per type |
Minimum |
Minimum cycle time per type |
Maximum |
Maximum cycle time per type |
Diagram options
Element |
Description |
|---|---|
Counting Facility |
The displayed target cycle time and the average, median, minimum and maximum values refer to this facility. Deactivated if only one counting facility is available. |
Show Connecting Lines |
When activated, the individual data points are connected to each other by lines. |