The Facility events report shows an overview of the facility events for specific facilities in the selected time period.
The number of facility events displayed in the table view is limited to 2500. However, in a CSV export, all events are always exported.
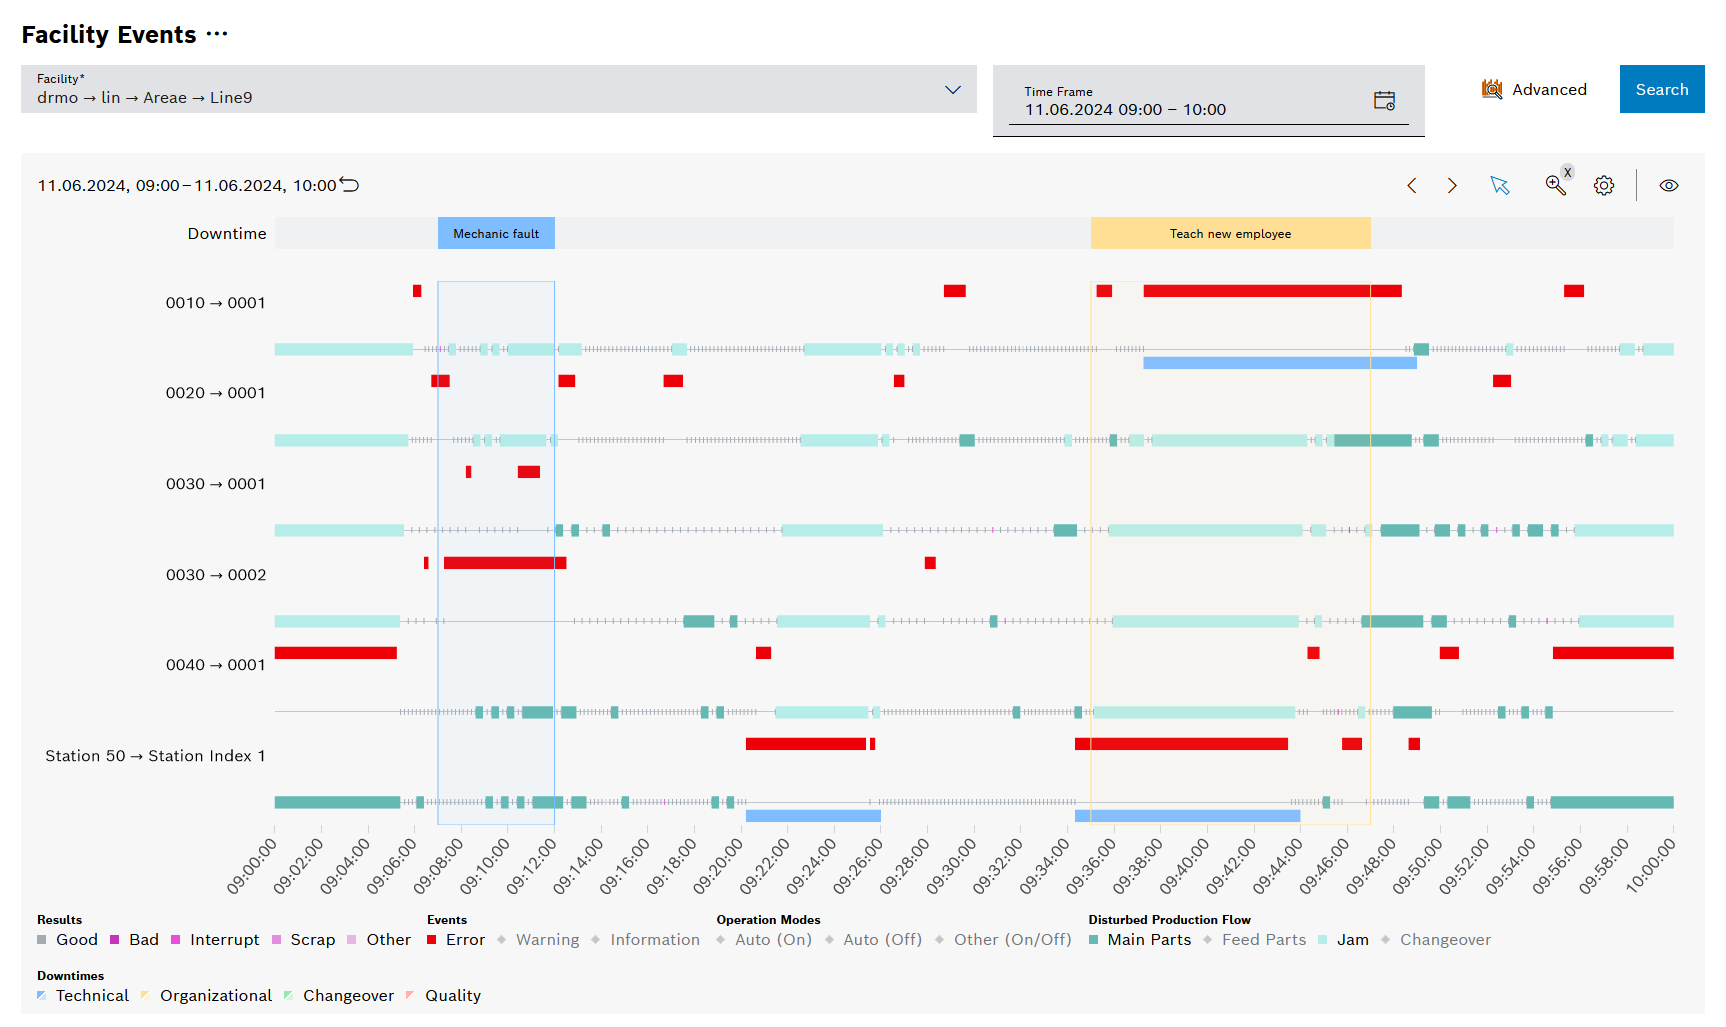
Legend
Click on the elements in the legend to show or hide them. Hidden elements are grayed out in the legend and the preceding icon is rotated.
Element |
Description |
|---|---|
Results |
Category of process results (good, poor, abort, scrap, other) |
Events |
Category of facility events (fault, warning, information) |
Operating Modes |
Displays the operating mode of the setup event, such as Auto (On), Auto (Off), and Other (On/Off) |
Disrupted production flow |
Shows the reason for the disrupted production flow (main parts, feed parts, bottleneck, setup) |
Downtimes |
Category of downtime (technical, organizational, changeover-related, quality) |
Diagram options
Element |
Description |
Display downtime markings |
Projects line downtimes to all facilities starting from the top line |
Downtime category |
Selection of the displayed downtime categories |
Downtime type |
Display of only planned, only unplanned, or all downtimes Planned downtimes are shown in gray, unplanned downtimes in the corresponding category color. |
User Manual | Nexeed Line Control