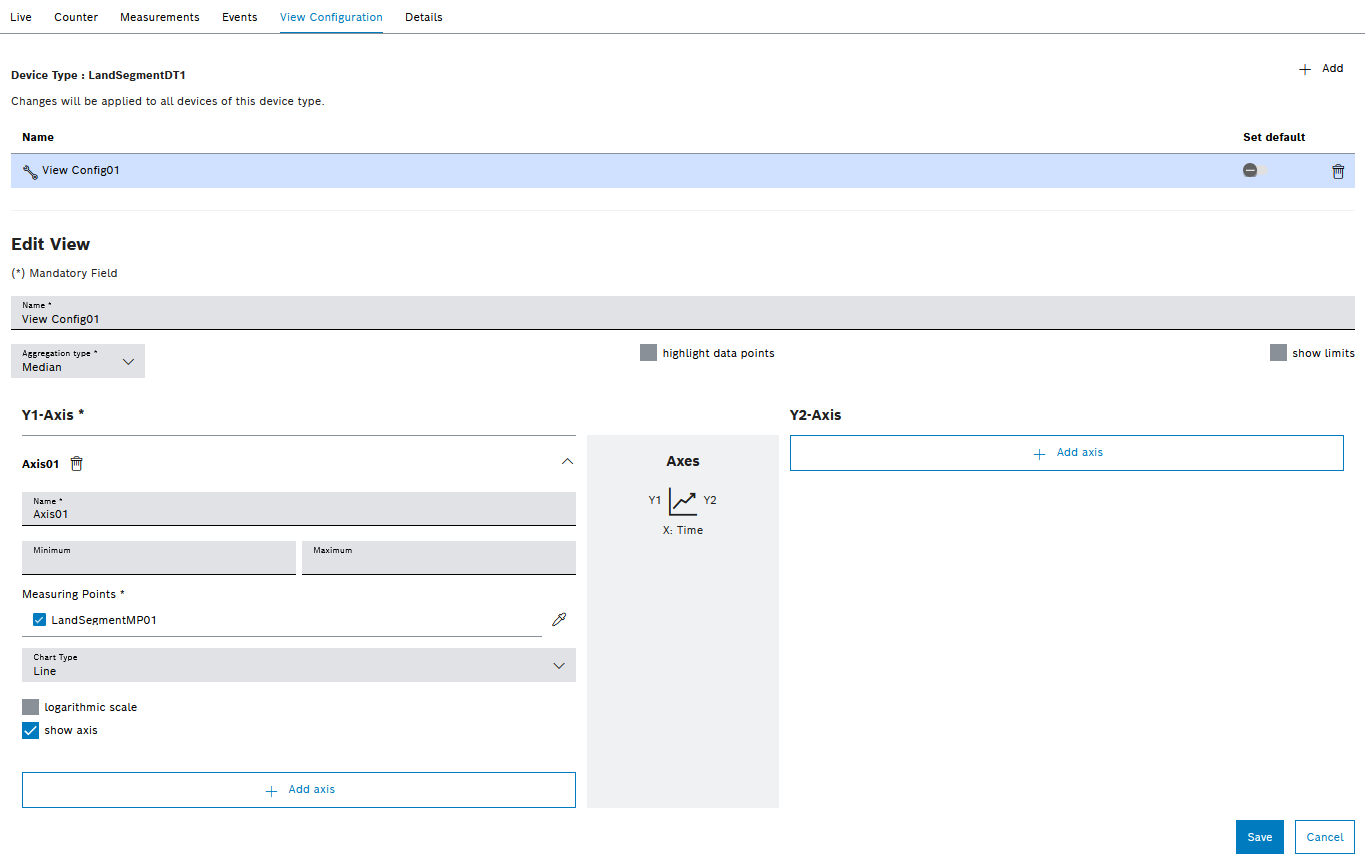
If a device is selected in the Efficiency analysis > Condition monitoring menu, the detailed view opens. The detailed view of the View configuration tab displays all views for the device type of the selected device. The views are created for a device type. The views apply to all devices of the device type. In the View configuration tab, new views can be created, existing views can be configured and views can be defined as standard. When a view is selected from the table, the editing mode opens below the table.
Element/icon/column |
Description |
|---|---|
|
Add a view. |
Name |
Name of the view |
Set as default |
Define the view as the default. Only one view can be set as the default view. If a default view is enabled, it is automatically preselected in the Live and Measured Values tabs.
|
|
Delete view. |
Save |
Save changes to the view. |
Edit View
Element/icon/column |
Description |
|---|---|
Name |
Assign the name of the view. |
Aggregation type |
Select aggregation type. Multiple aggregation types can be selected. If you select multiple aggregation types, you can compare the different aggregation types of the historical measured values.
|
Highlight data points |
Highlight data points in the view in the Live and Measured Values tabs. |
Display limits |
Display machine limit values. |
|
Add Y axis on the right or left side |
Y1 axis/Y2 axis
Element/icon/column |
Description |
|---|---|
Name |
Assign a designation for the axis. |
|
Delete view. |
Minimum |
Define the smallest value for the axis. |
Maximum |
Define the largest value for the axis. |
Measurement point |
Select the measuring points to be displayed on the axis. Measuring points are created in the device in the Nexeed Master Data Management module. All measurement points created for the device are displayed. Measuring points can be assigned colors to distinguish them from other measuring points. |
Chart type |
Scatter Display measurement data in a point cloud. Spline Display measuring points in a line diagram with curves. Line Display measuring points in a line diagram with lines. Column Display measurement data in a bar chart. Area Display measurement data in an area chart. Step Display measurement data in a line diagram with lines that go up or down in steps. |
Logarithmic scale |
Use logarithmic scales. A logarithmic scale is a non-linear scale used to represent data of a wide range of values. On a logarithmic scale, values that increase by ten times over the same time periods are displayed as a straight line. |
Axis visible |
Show or hide axis |