![]()
![]()
![]()
![]()
|
|
|
|
|
Under Shopfloor management > Global production overview on the Comparison tab, the key performance indicators of production units are compared with one another.
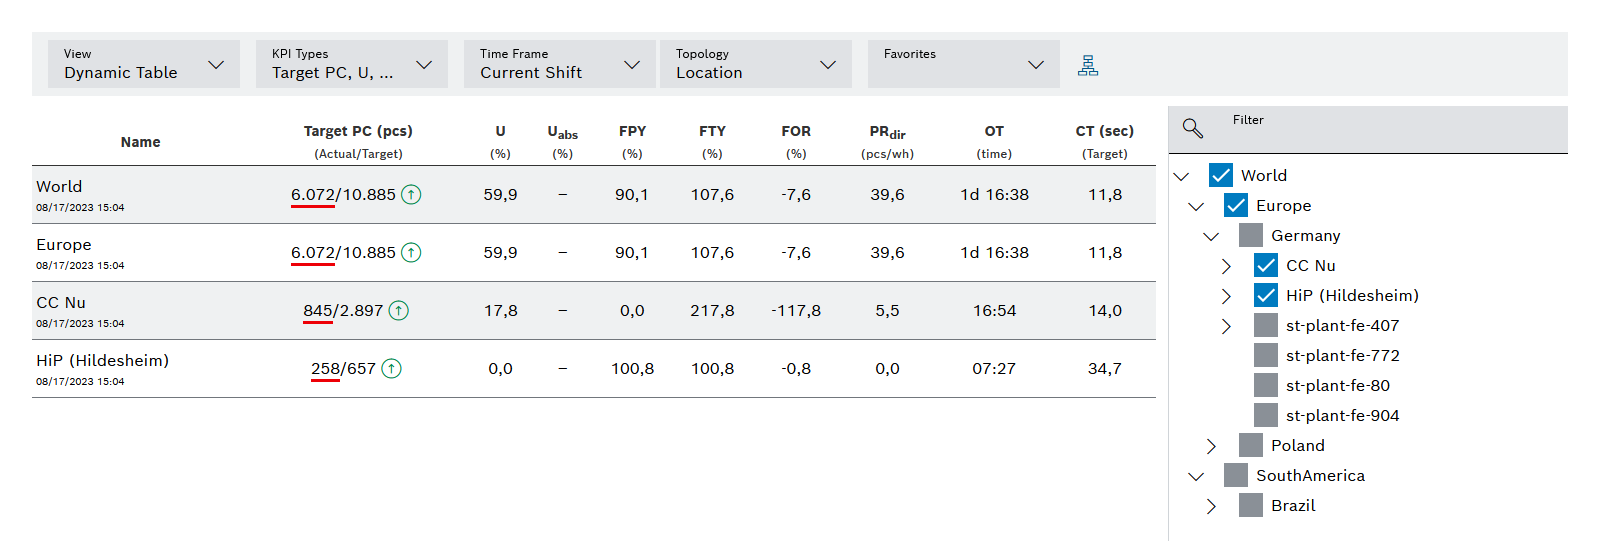
There are two areas on the Comparison tab: The comparison itself, and the filter, which can be used to show and hide production units for comparison.
The comparison can be represented in three ways:
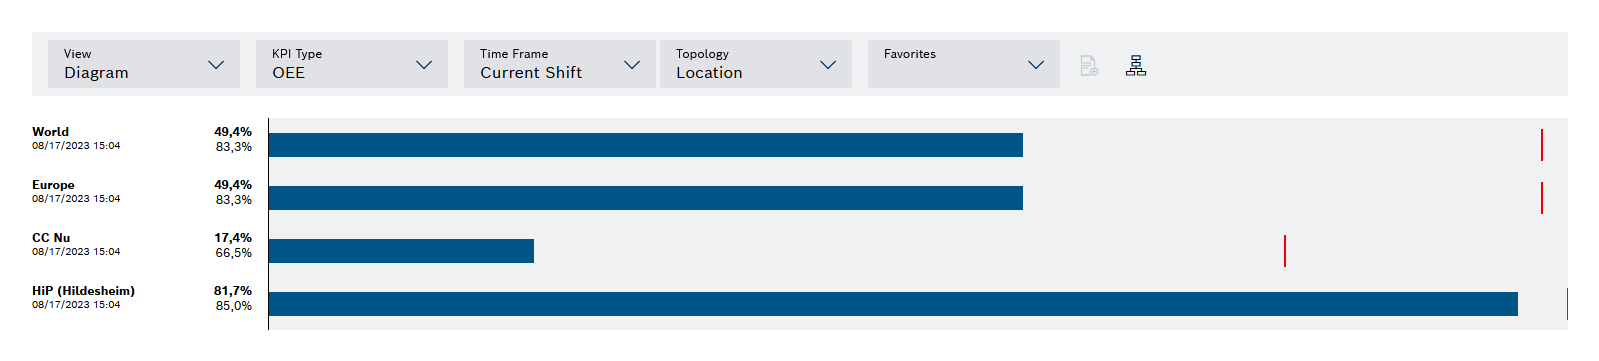
Diagram
Element/icon |
Description |
|---|---|
Presentation |
Select chart. |
KPI type |
Select a key performance indicator type. |
Time Frame |
Select the time segment to use for the comparison. |
Topology |
Select whether to display locations or business units. |
Favorites |
Select favorites group. |
|
Show or hide the hierarchy tree. Blue = shown |
|
Show or hide the total row. The sum of the KPI value (e.g. quantities) is shown as a bar below all selected lines. Blue = enabled Only selectable if exclusively lines are filtered for comparison. |
|
Actual value display |
|
Setpoint display |
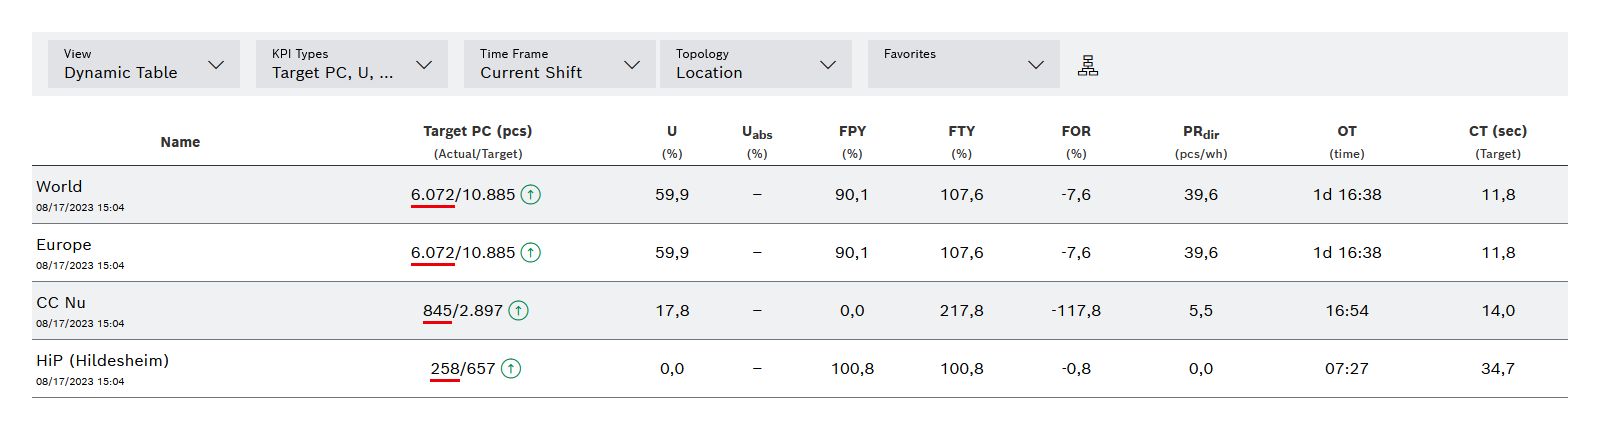
Dynamic composition
Element/icon |
Description |
|---|---|
Presentation |
Select Dynamic Composition. |
KPI types |
Select all key performance indicator types to be displayed. |
Time Frame |
Select the time segment to use for the comparison. |
Topology |
Select whether to display locations or business units. |
Favorites |
Select favorites group. |
|
Show or hide the hierarchy tree. Blue = shown |
|
Display of the trend for the OEE and PC key figures in the current shift:
|
Colored line below the actual values |
Status display for the key performance indicators OEE and PC:
|
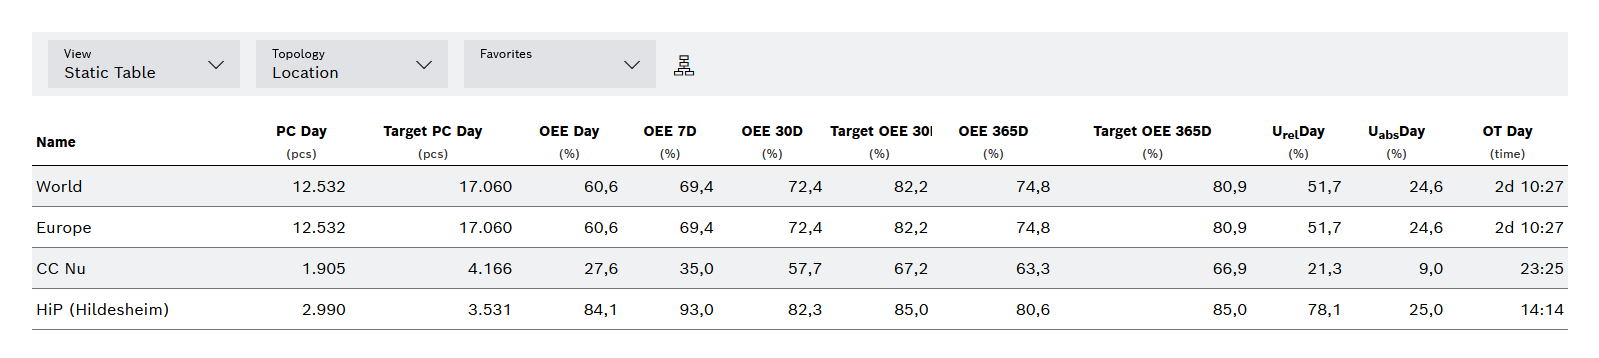
Static composition
Element/icon |
Description |
|---|---|
Presentation |
Select Static Composition. |
Topology |
Select whether to display locations or business units. |
Favorites |
Select favorites group. |
|
Show or hide the hierarchy tree. Blue = shown |
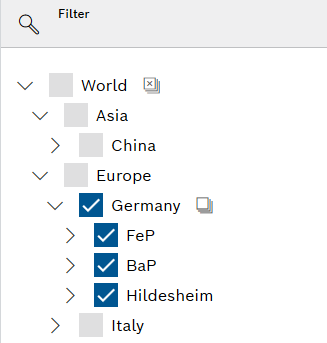
Filter
Element/icon |
Description |
|---|---|
|
Search for the production unit in the filter. |
|
Deselect all production units for comparison. |
|
Select all subordinate production units for comparison. |
|
Deselect all subordinate production units for comparison. |