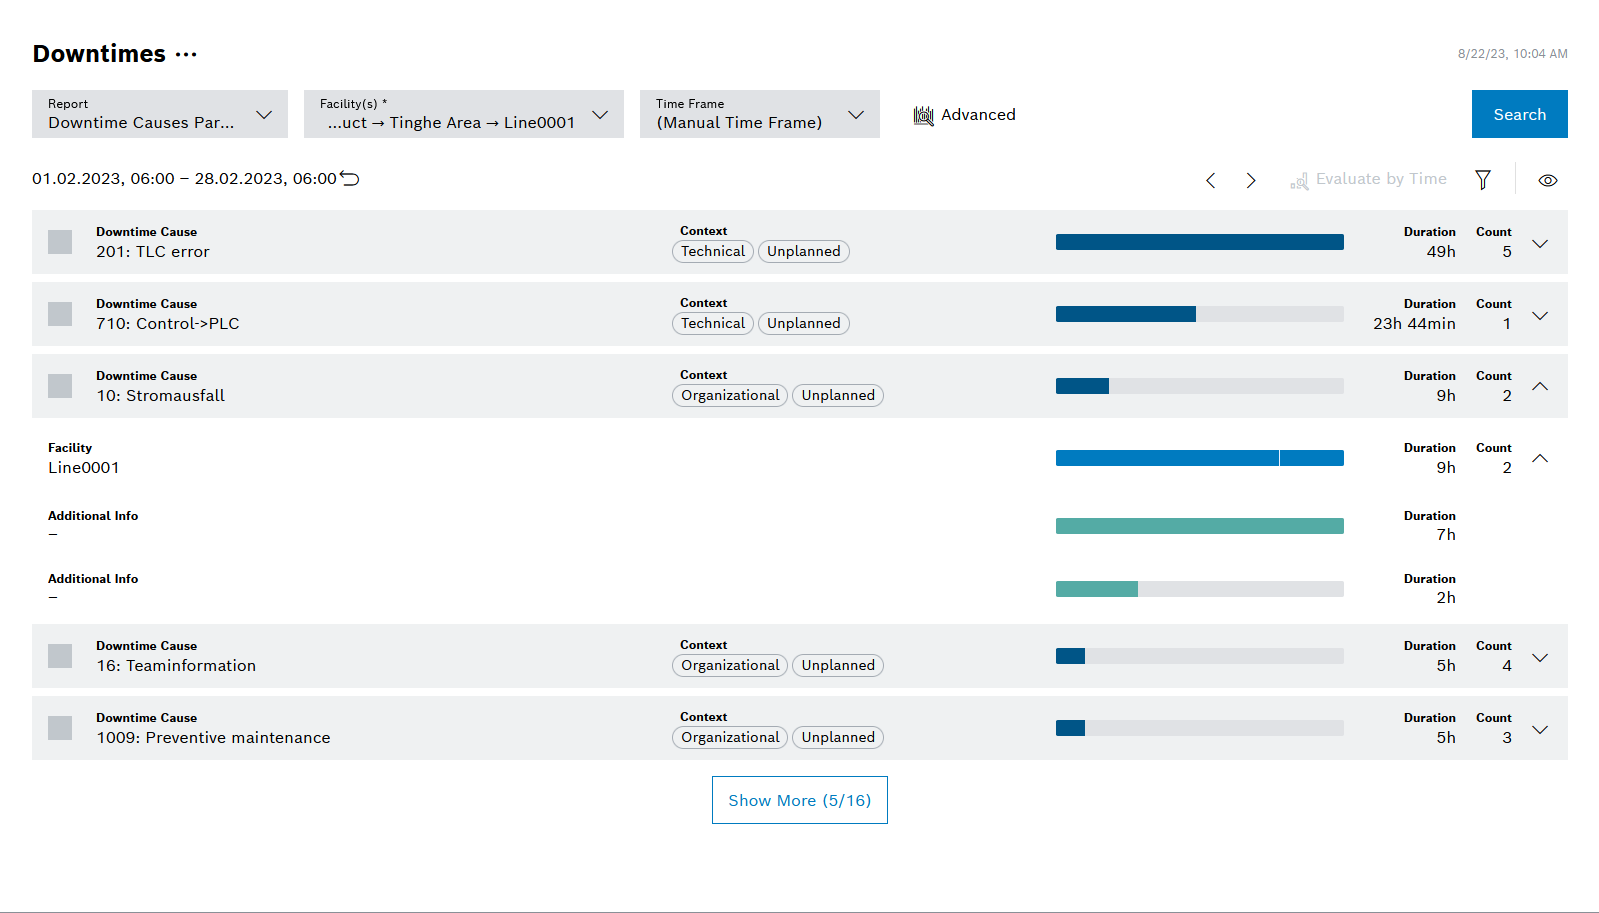
The Pareto Downtime Causes report shows downtimes with downtime causes in the form of a Pareto chart.
Element |
Description |
|---|---|
Downtime cause |
Name of the downtime cause |
Duration (bar) |
Duration of the downtime in the form of a bar |
Duration |
Duration of the downtime |
Count |
Number of downtimes that occurred |
Facility |
Facility at which this downtime occurred. |
Additional information |
Further information on the downtime |
|
By activating one or more checkboxes, you can click on Evaluate over time to display these cause(s) in the Downtimes by time report. |
Diagram options
Element |
Description |
|---|---|
Display |
Selection between Durations with overlaps, Summarized durations and Output-related durations Durations with overlaps occur when more than one error occurs simultaneously at one or more facilities. |
Simplified View |
Shows the downtimes in the form of a Pareto bar chart Only when selecting the Durations with overlaps or Summarized durations display. |
Number of Rows |
Number of rows added by clicking Show More |
Downtime Category |
Selection of the downtime category: Technical, organizational, changeover-related and quality |
Type |
Selection of the downtime type: Planned and unplanned, only planned, or only unplanned |
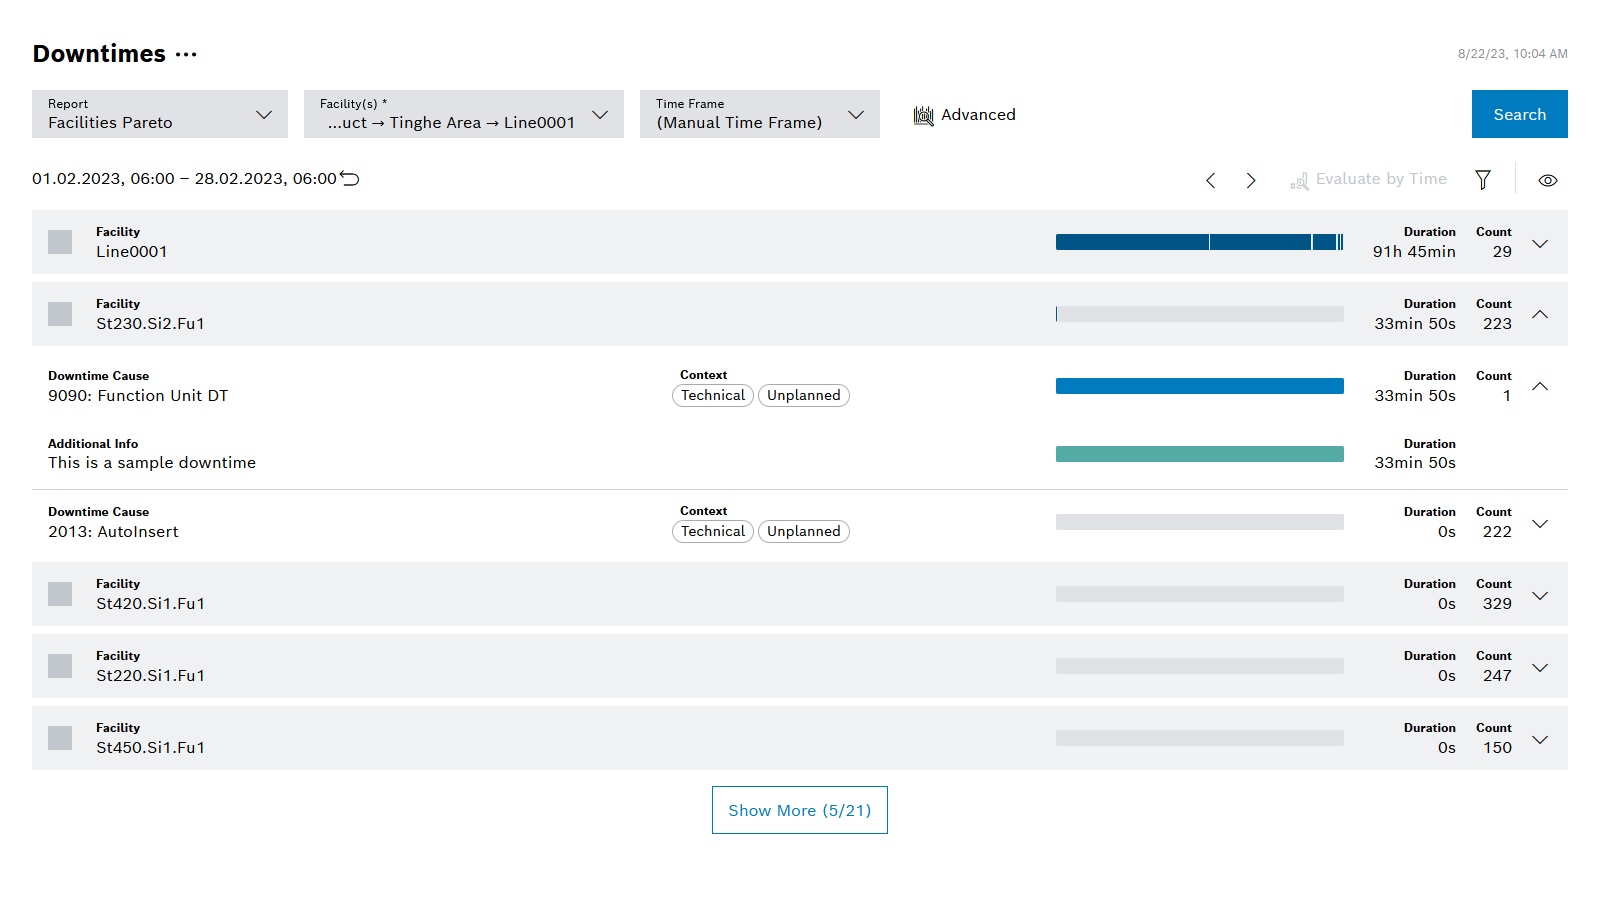
The Facilities Pareto report shows downtimes over facilities in the form of a Pareto chart.
Element/icon |
Description |
|---|---|
Downtime cause |
Name of the downtime cause |
Duration (bar) |
Duration of the downtime in the form of a bar |
Duration |
Duration of the downtime |
Count |
Number of downtimes that occurred |
Facility |
Facility at which this downtime occurred. |
Additional information |
Further information on the downtime |
|
By marking one or more facilities, you can click on Evaluate over time to display the cause(s) in the Downtimes by time report |
Diagram options
Element |
Description |
Display |
Selection between Durations with overlaps and Summarized durations Durations with overlaps occur when more than one error occurs simultaneously at one or more facilities. |
Number of Rows |
Number of rows added by clicking Show More |
Downtime Category |
Selection of the downtime category: Technical, organizational, changeover-related and quality |
Type |
Selection of the downtime type: Planned and unplanned, only planned, or only unplanned |
The Output-related durations diagram shows time-sorted, output-related losses at the end of the line. Losses marked in blue can be assigned to a downtime; purple-colored losses cannot be assigned to a downtime.
A Pareto chart of the downtimes that can be assigned to a line loss and the respective duration of the line loss are also displayed.
To display the Output-related durations diagram, click on the Output-related durations view in the diagram options of the Downtimes report.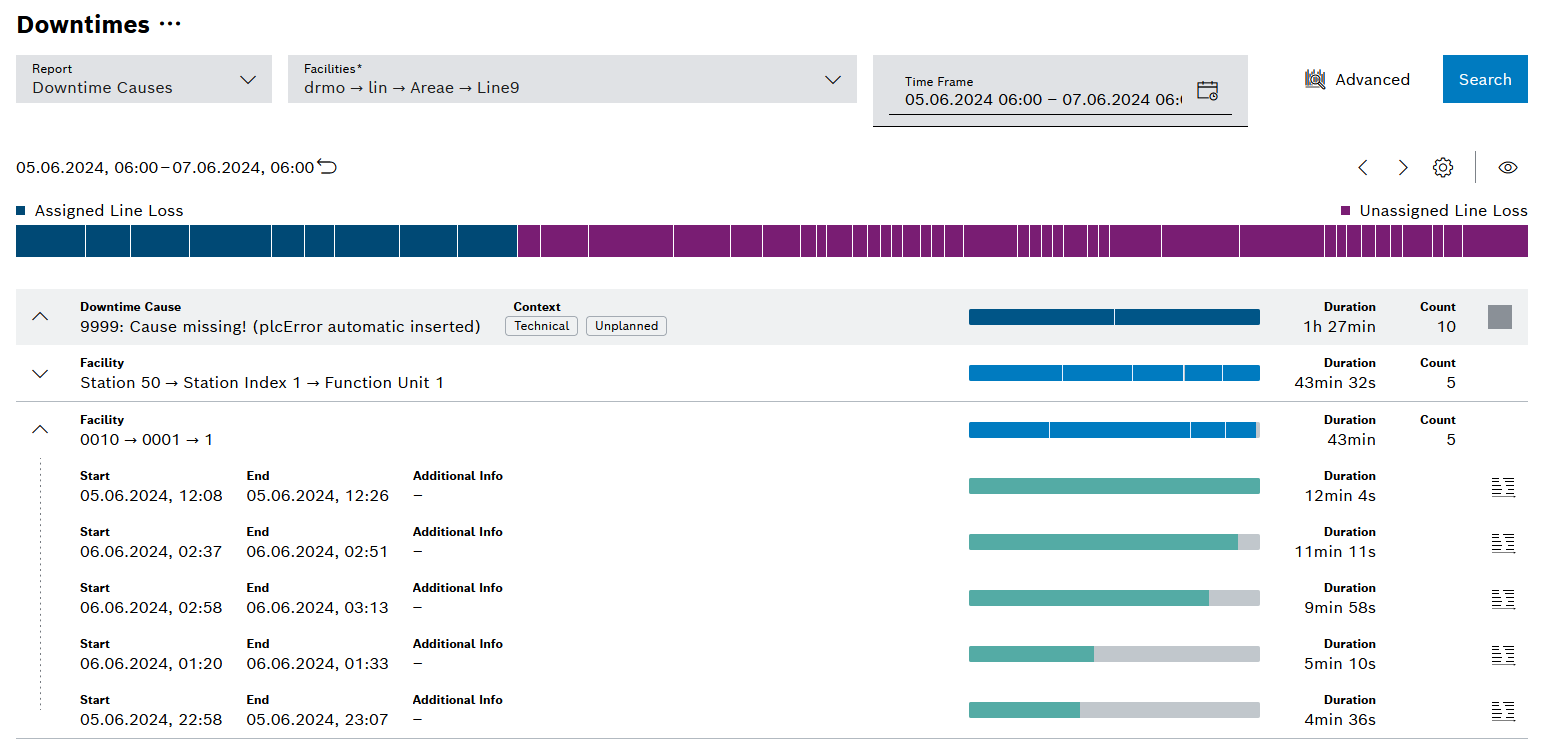
Display of downtimes as Pareto (such as Downtime causes Pareto) with the following differences:
Element |
Description |
Start |
Start of downtime |
End |
End of downtime |
Duration |
Duration of the associated line loss |
|
Graphical display of |
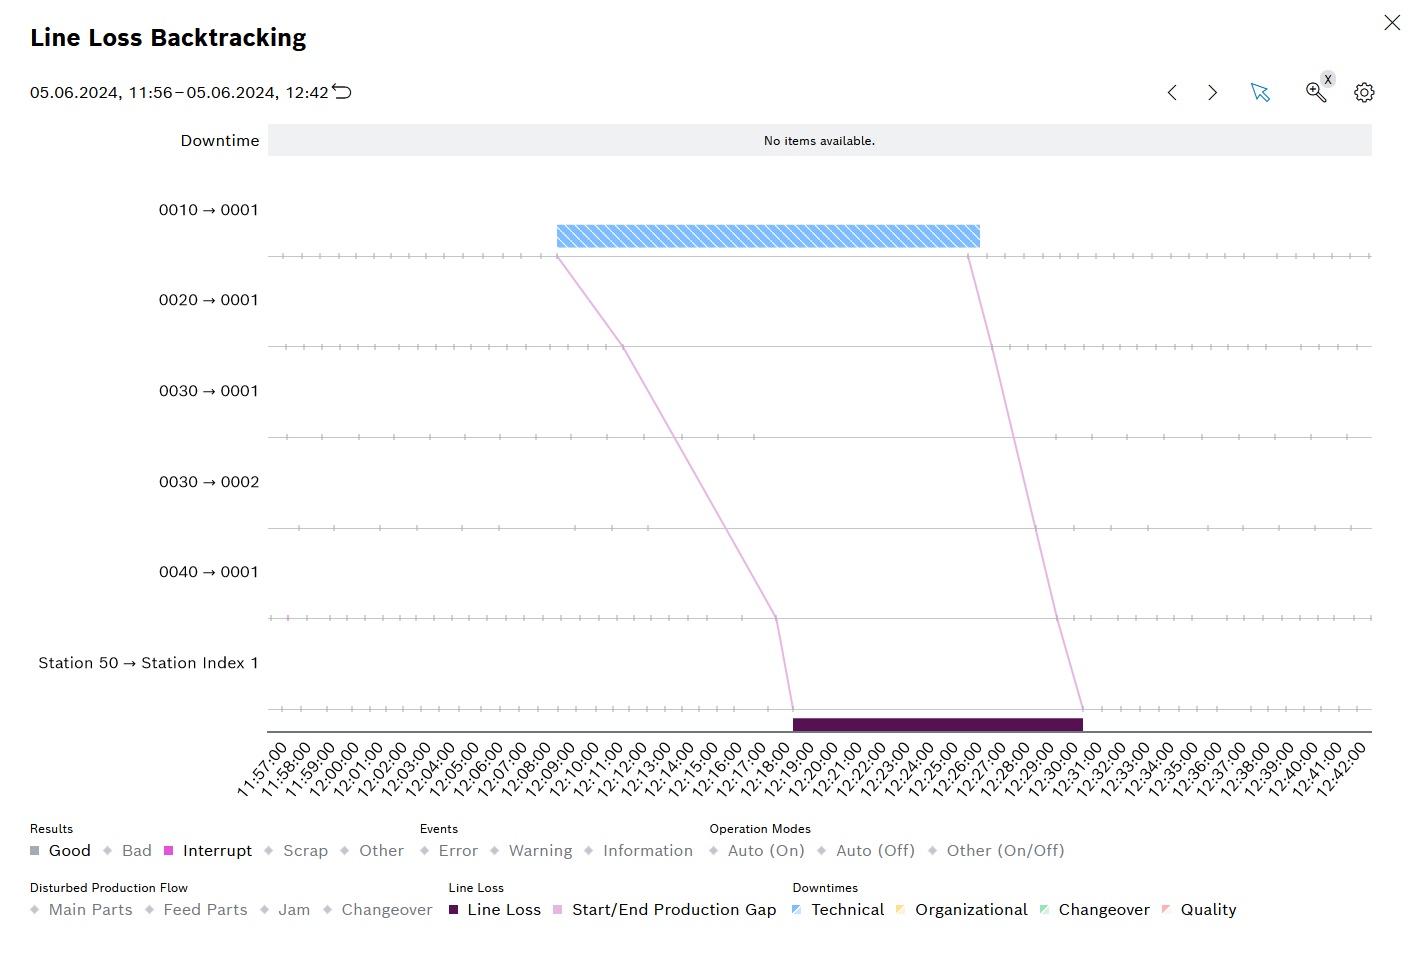
Graphical display of line loss traceability
To display the Line loss traceability graphically, click on the corresponding blue or purple bar or on ![]() .
.
The graphic shows the downtime, the trend of the determined production gap across the individual facilities in line graph form (delimited by pink lines), and the assigned output-related losses at the end of the line (purple):
Legend
Click on the elements in the legend to show or hide them. Hidden elements are grayed out in the legend and the preceding icon is rotated.
Element |
Description |
|---|---|
Results |
Category of process results (good, poor, abort, scrap, other) |
Events |
Category of facility events (fault, warning, information) |
Operating Modes |
Displays the operating mode of the setup event, such as Auto (On), Auto (Off), and Other (On/Off) |
Disrupted production flow |
Shows the reason for the disrupted production flow (main parts, feed parts, bottleneck, setup) |
Line loss |
Shows the line loss and its start/end |
Downtimes |
Category of downtime (technical, organizational, changeover-related, quality) |
The Pareto downtime causes with trend report shows downtime causes as a Pareto and additionally with history.
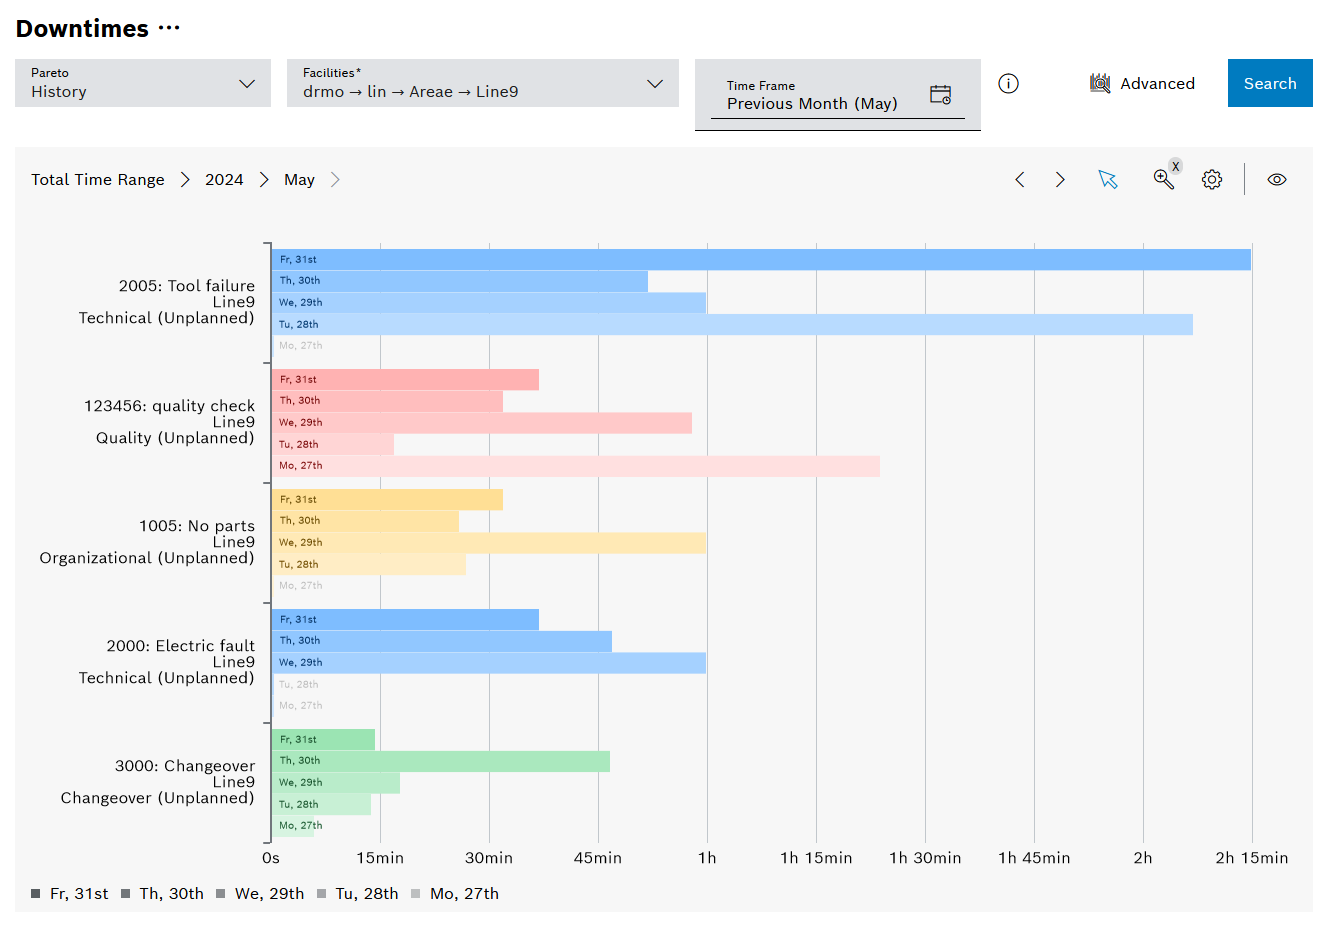
Depending on the query period, the report groups the history by day, month or year. The number of groupings can be selected automatically or manually in the advanced settings.
The time range is limited from the end by the selected history length
Diagram options:
Element |
Description |
|---|---|
Downtime Category |
Selection of the downtime category: Technical, organizational, changeover-related and quality |
Downtime Type |
Selection of the downtime type: Planned and unplanned, only planned, or only unplanned |
View history |
Display Pareto with or without historical trend |