Create View
Prerequisite
Condition Monitoring Administrator role
Procedure
- Call up the Efficiency analysis > Condition monitoring menu.
- Select device.
- In the detailed view, open the View configuration tab.
- Create a new view with
 Add.
Add. - Enter Name.
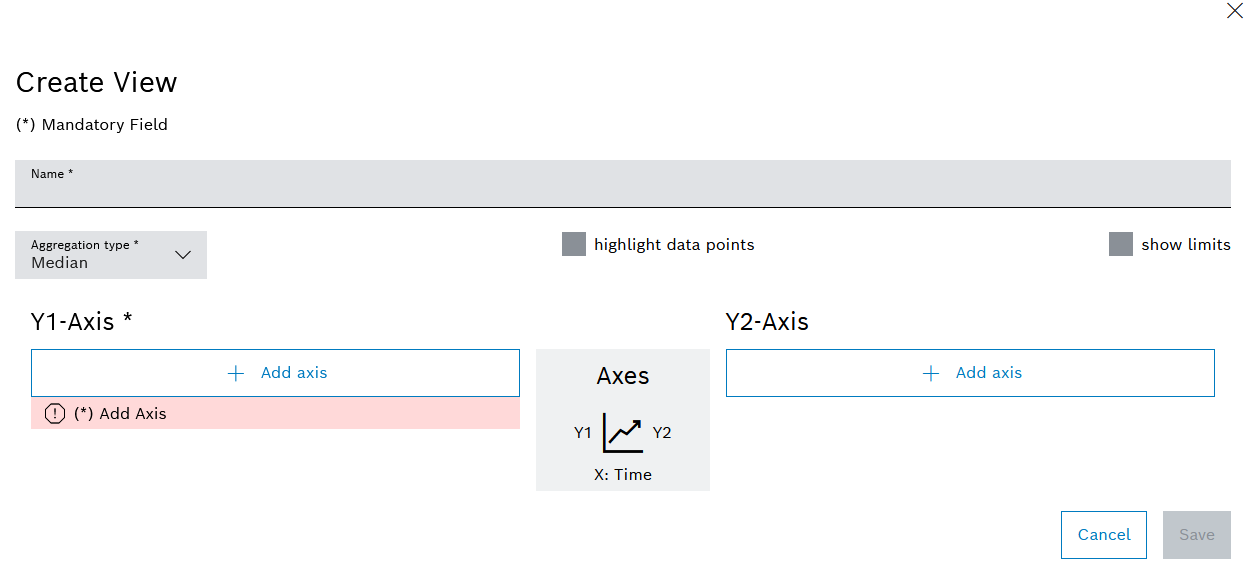
- To highlight data points in the view, activate the Highlight Data Points checkbox.
- To display the machine limits in the view, activate the Display Limits checkbox.
- Select one or more aggregation types from the Aggregation type drop-down list.
- Create Y axes on the left or right side with Add axis.
Any number of Y axes can be defined. Up to ten measuring points can be configured per view.
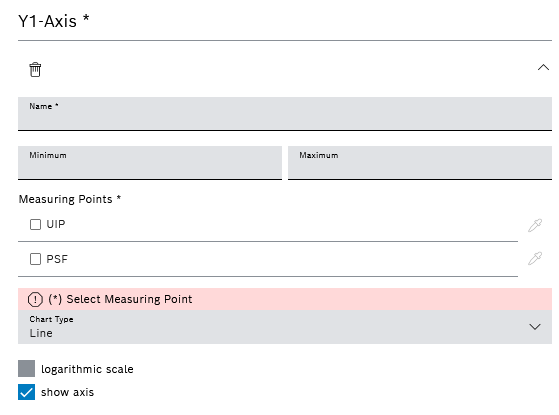
- Enter theName of the Y-axis .
- Enter a Minimum value and a Maximum value to be displayed on the Y axis.
- Select the measuring points to be displayed on the Y axis.
The measuring points of the device are created in the Nexeed Master Data Management module.
Manage or Create a New Measuring Point for a Device Type
- Assign a color to the measuring points using
 .
.If no color is selected, the color is automatically assigned by the system.
- Select a Diagram type from the drop-down list.
View configuration tab
- To display the data in a logarithmic scale, activate the Logarithmic Scale checkbox.
- To show a Y axis by default, activate the Axis visible checkbox.
- To create another Y axis on the left or right side, select Add axis and repeat steps 10 to 16.
- Create view with Save.
The view has been added and appears in the View configuration tab.