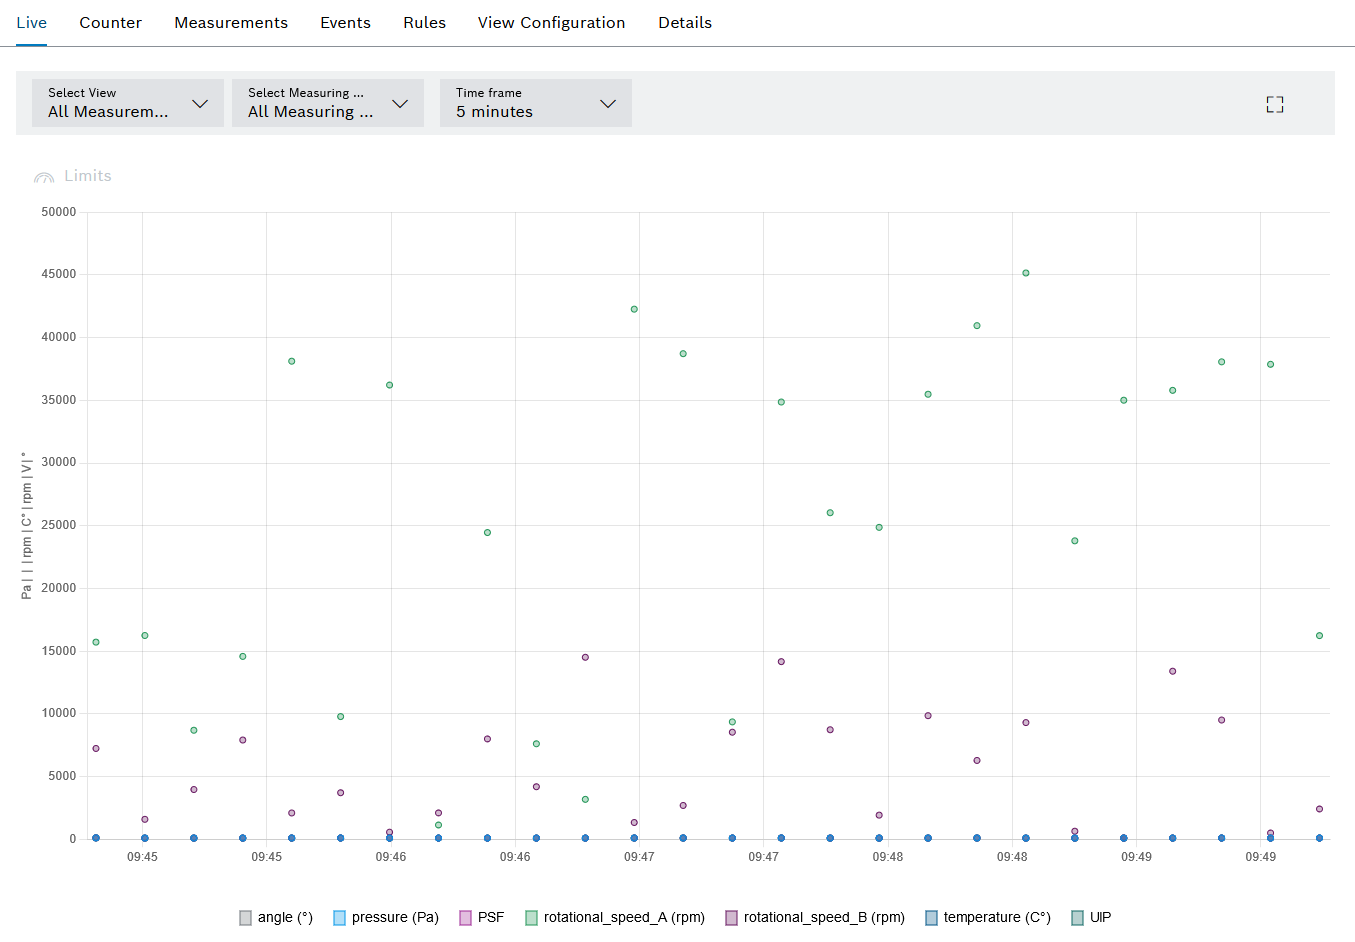
If a device is selected in the Efficiency analysis > Condition monitoring menu, the detailed view opens. In the detailed view in the Live tab, the current measured values of the device are displayed with the measuring points of the selected view. Views can be configured in the View Configuration tab.
Element/icon/column |
Description |
|---|---|
Select view |
Select a view from the drop-down list. The drop-down list displays all the device views created from the View Configuration tab. All measuring points Display all measurements of the device. |
Select Measuring Point |
Select the measuring point to be displayed from the drop-down list. The drop-down list displays all created measurement points for the device. All measuring points Display all measuring points of the device. |
Time Frame |
Select the time range in which the measured values are displayed. By default, the last five minutes are displayed. |
|
Open full-screen mode. The full-screen mode can be closed with [ESC]. |
|
Show and hide limit values from the measured value messages. Limit values are only available with the setting Aggregation level — Raw data (max. 10,000 measured values). The setting can be selected in the aggregation settings in the Measured values tab. |