![]()
![]()
![]()
![]()
|
|
|
|
|
Under Shopfloor management > Global production overview, the Map tab provides a quick overview of the production units with the key performance indicators OEE (overall equipment effectiveness) and PC (part count), as well as their trends.
Depending on the legal situation of individual countries, the card may be deactivated by the system operator.
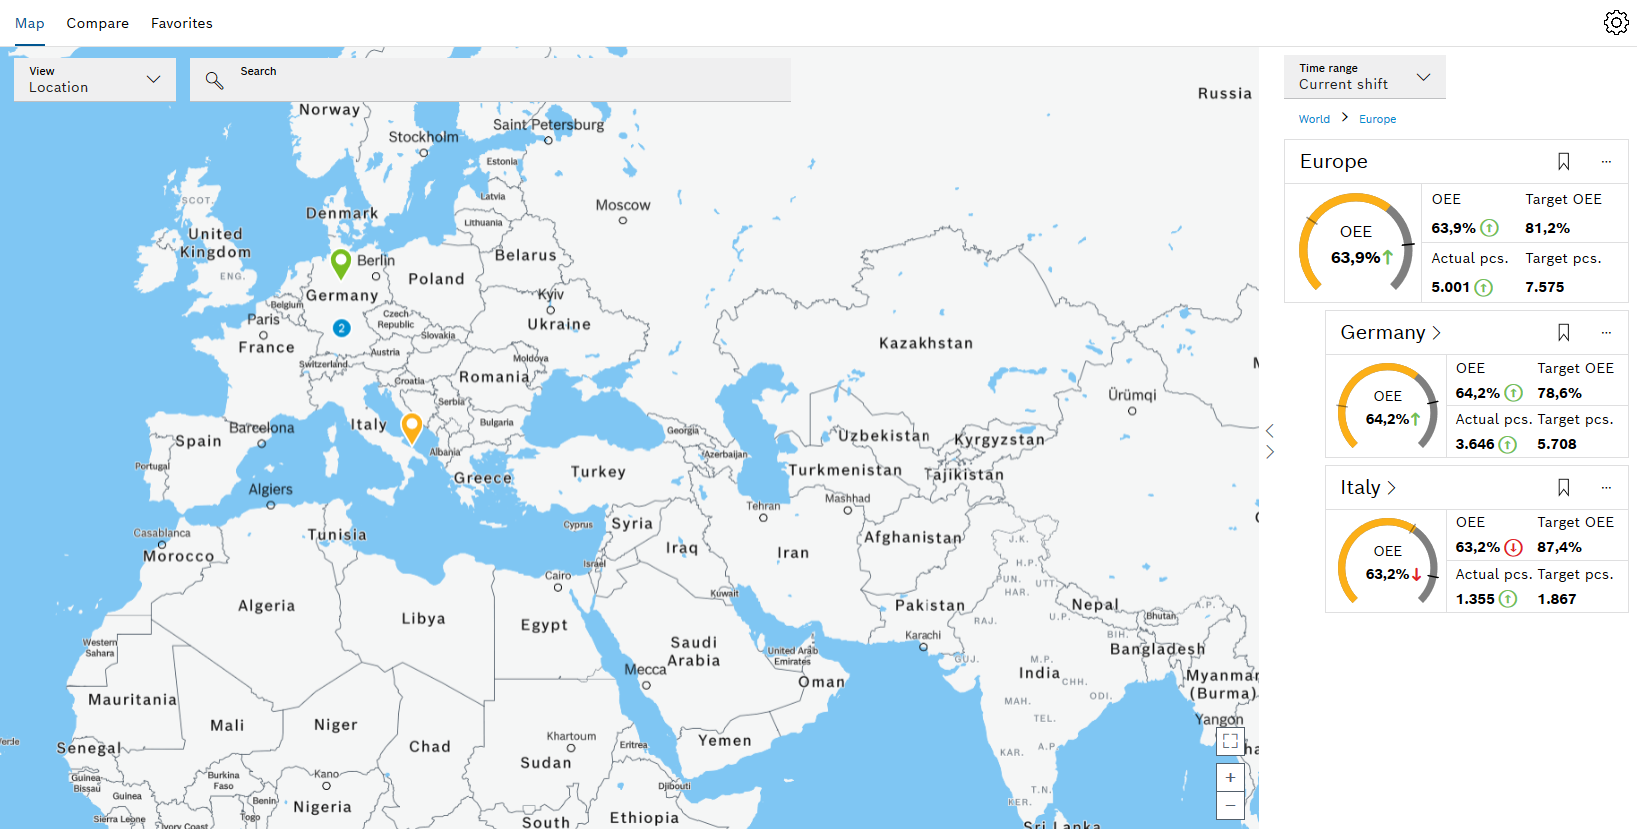
In the Map tab, there are two areas: the map and the detailed view.
Marked on the map are the locations of the plants that are integrated into the global production overview. The detailed view can be shown or hidden. It shows the production units hierarchically arranged in the form of data cards. These display the actual and setpoint values as well as the trend of the key performance indicators both graphically and numerically.
Map
Element/icon |
Description |
|---|---|
Topology |
Choose between location and business unit. |
|
Search for a production unit. |
|
Displays the number of plants in an area when the scale of the map is too small |
|
Displays the location of a plant The colors correspond to the status of the OEE values:
|
|
Switch to full screen mode or exit full screen mode. |
|
Zoom in or out. |
|
Expand or retract the detailed view. |
Detailed view, header
Element/icon |
Description |
|---|---|
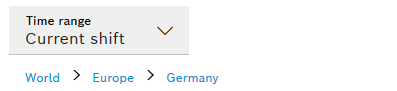
Time Frame |
Select the time segment for which the key performance indicators are to be displayed. |
World > Europe > Germany |
Hierarchy path To navigate up the hierarchy, click an entry. |
Detailed view, data card
Element/icon |
Description |
|---|---|
|
Favorite Mark production unit as favorite or remove production unit from favorites. |
|
Options menu Show links to other systems. Access a link from the Favorites tab Show date and time of the last update. |
|
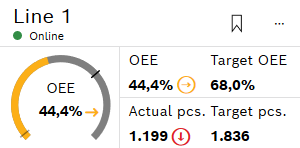
Status of the data query (Only for "Line" production unit) The time after which data is considered outdated can be adjusted under Settings |
|
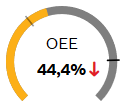
Graphical display of OEE value with action limit (gray hyphen) and setpoint (black hyphen) The colors of the ring indicate the status of the OEE value:
The OEE value is given in the ring as a percentage. A colored arrow indicates the trend of the OEE value. |
|
Trend of the key performance indicator The colors have the following meaning:
The trend is calculated from the current values and can be adjusted under Settings |