Select device for analysis
Use a filter
Only measured values with colored process curves can be displayed, not those with gray curves: Permanently highlight the process curve
Prerequisite
Measuring points are defined in the Master Data Management module.
Procedure
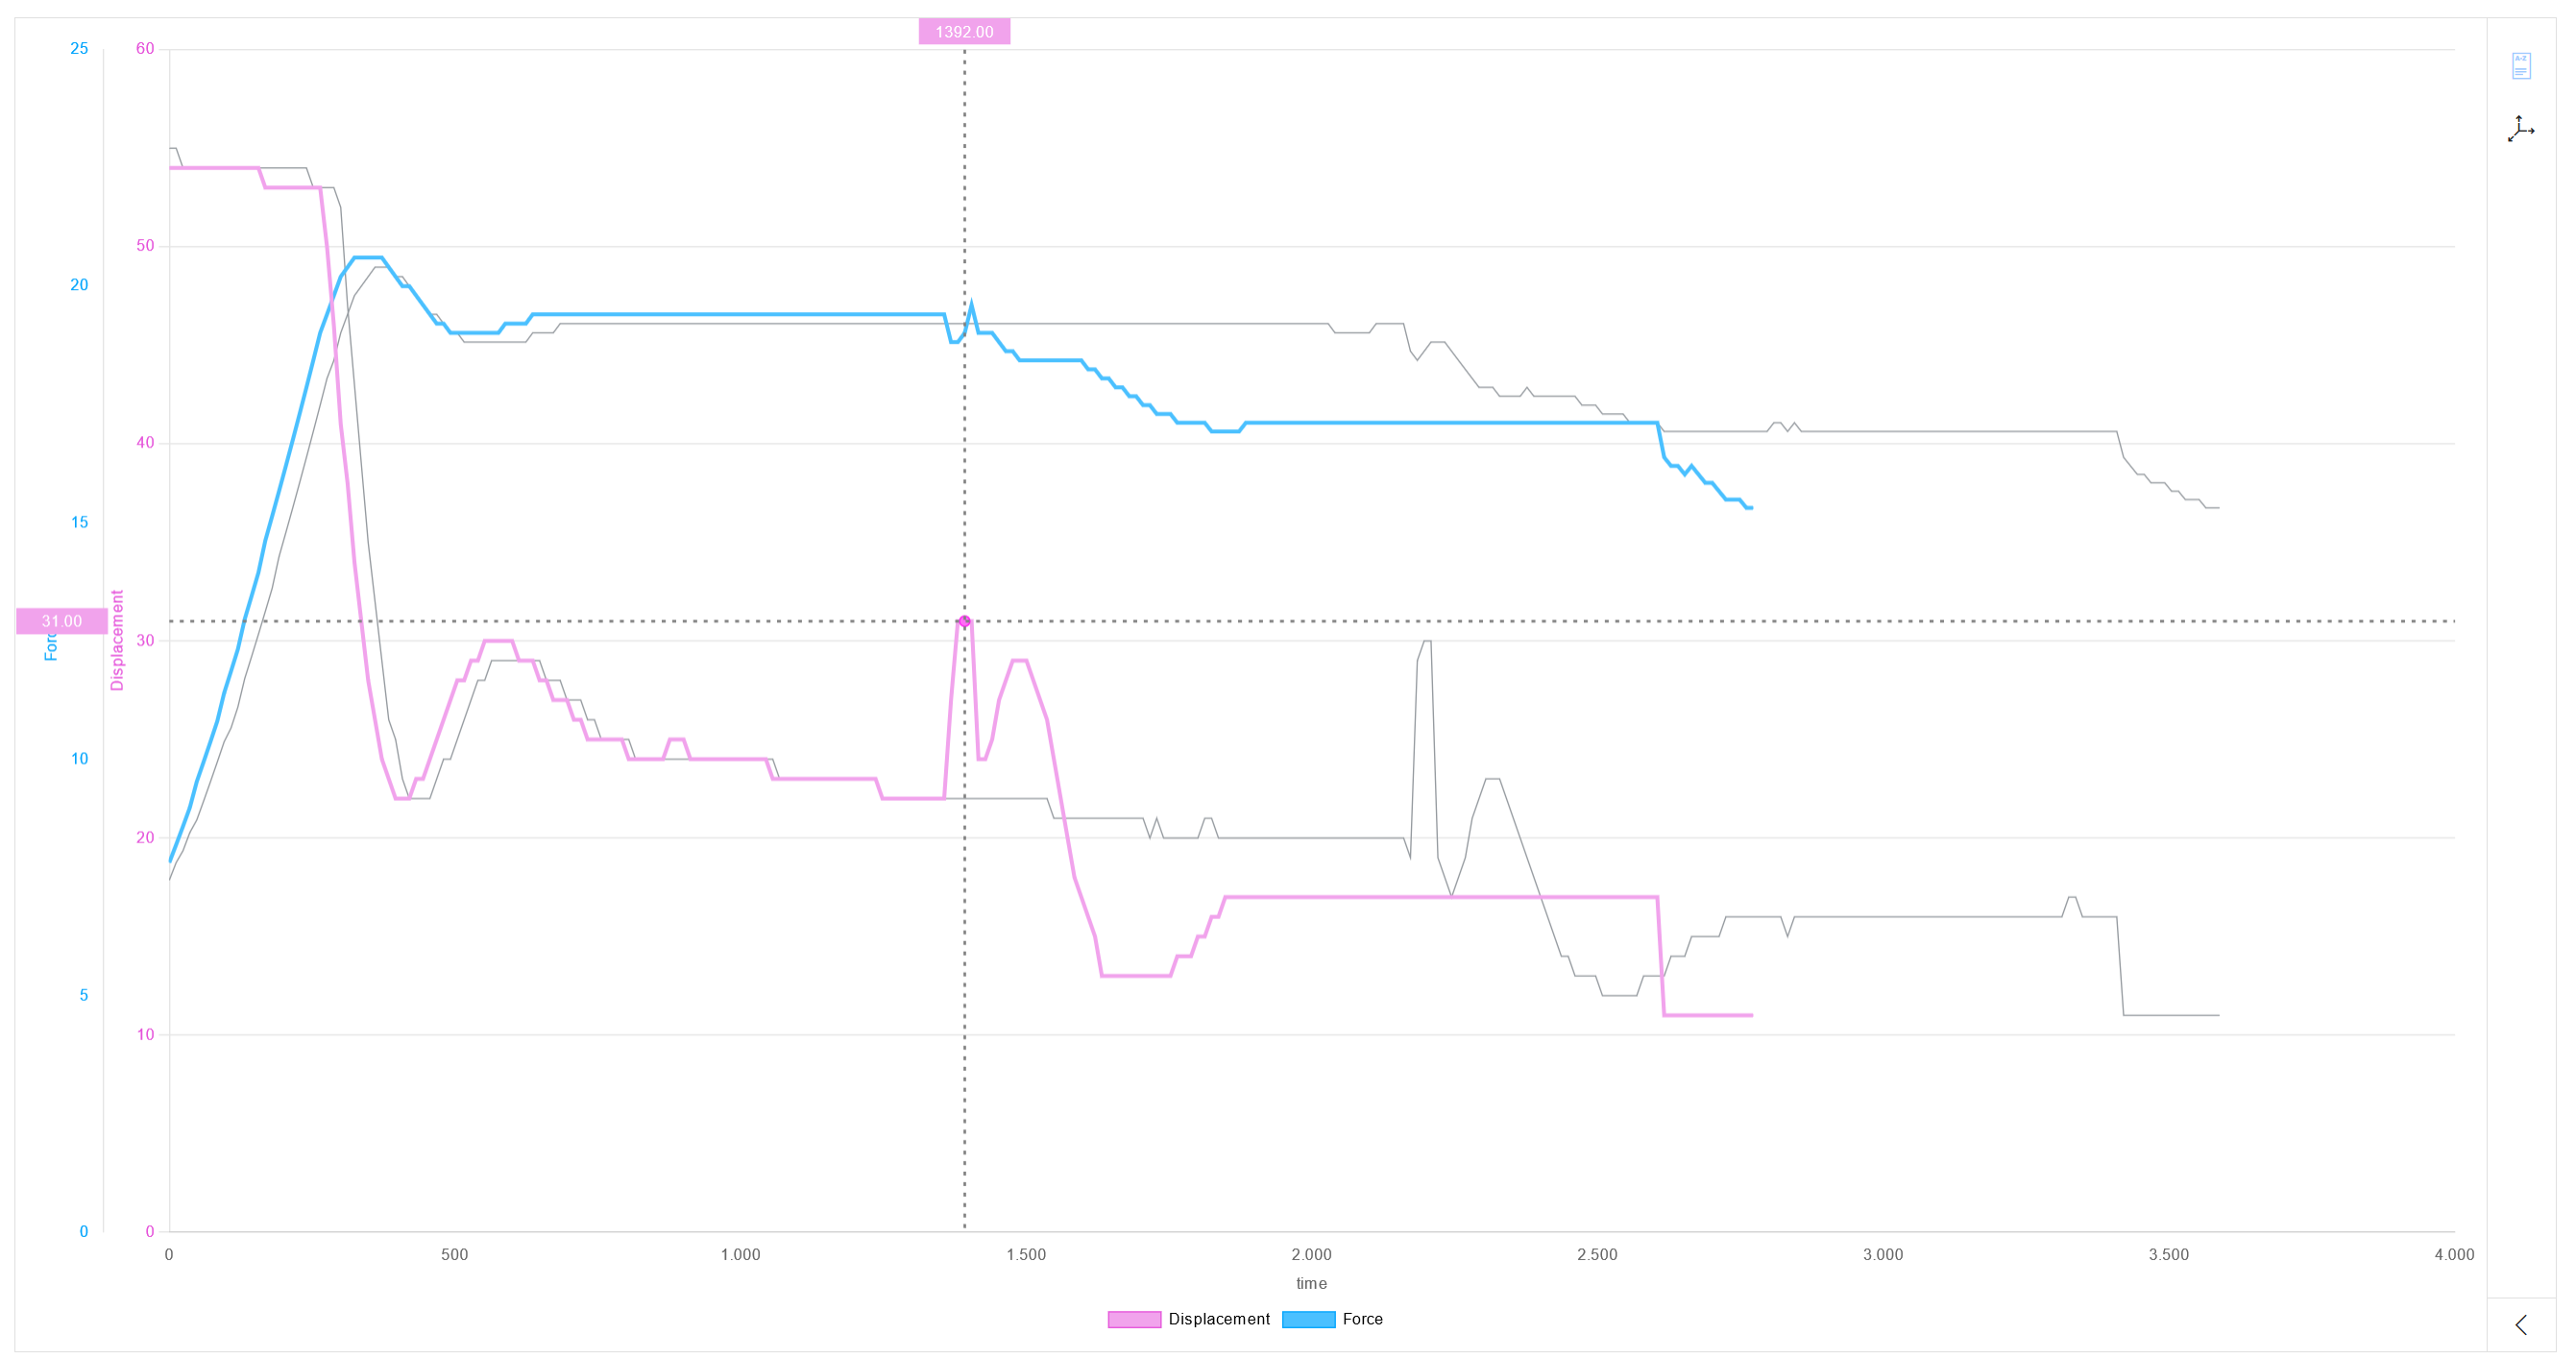
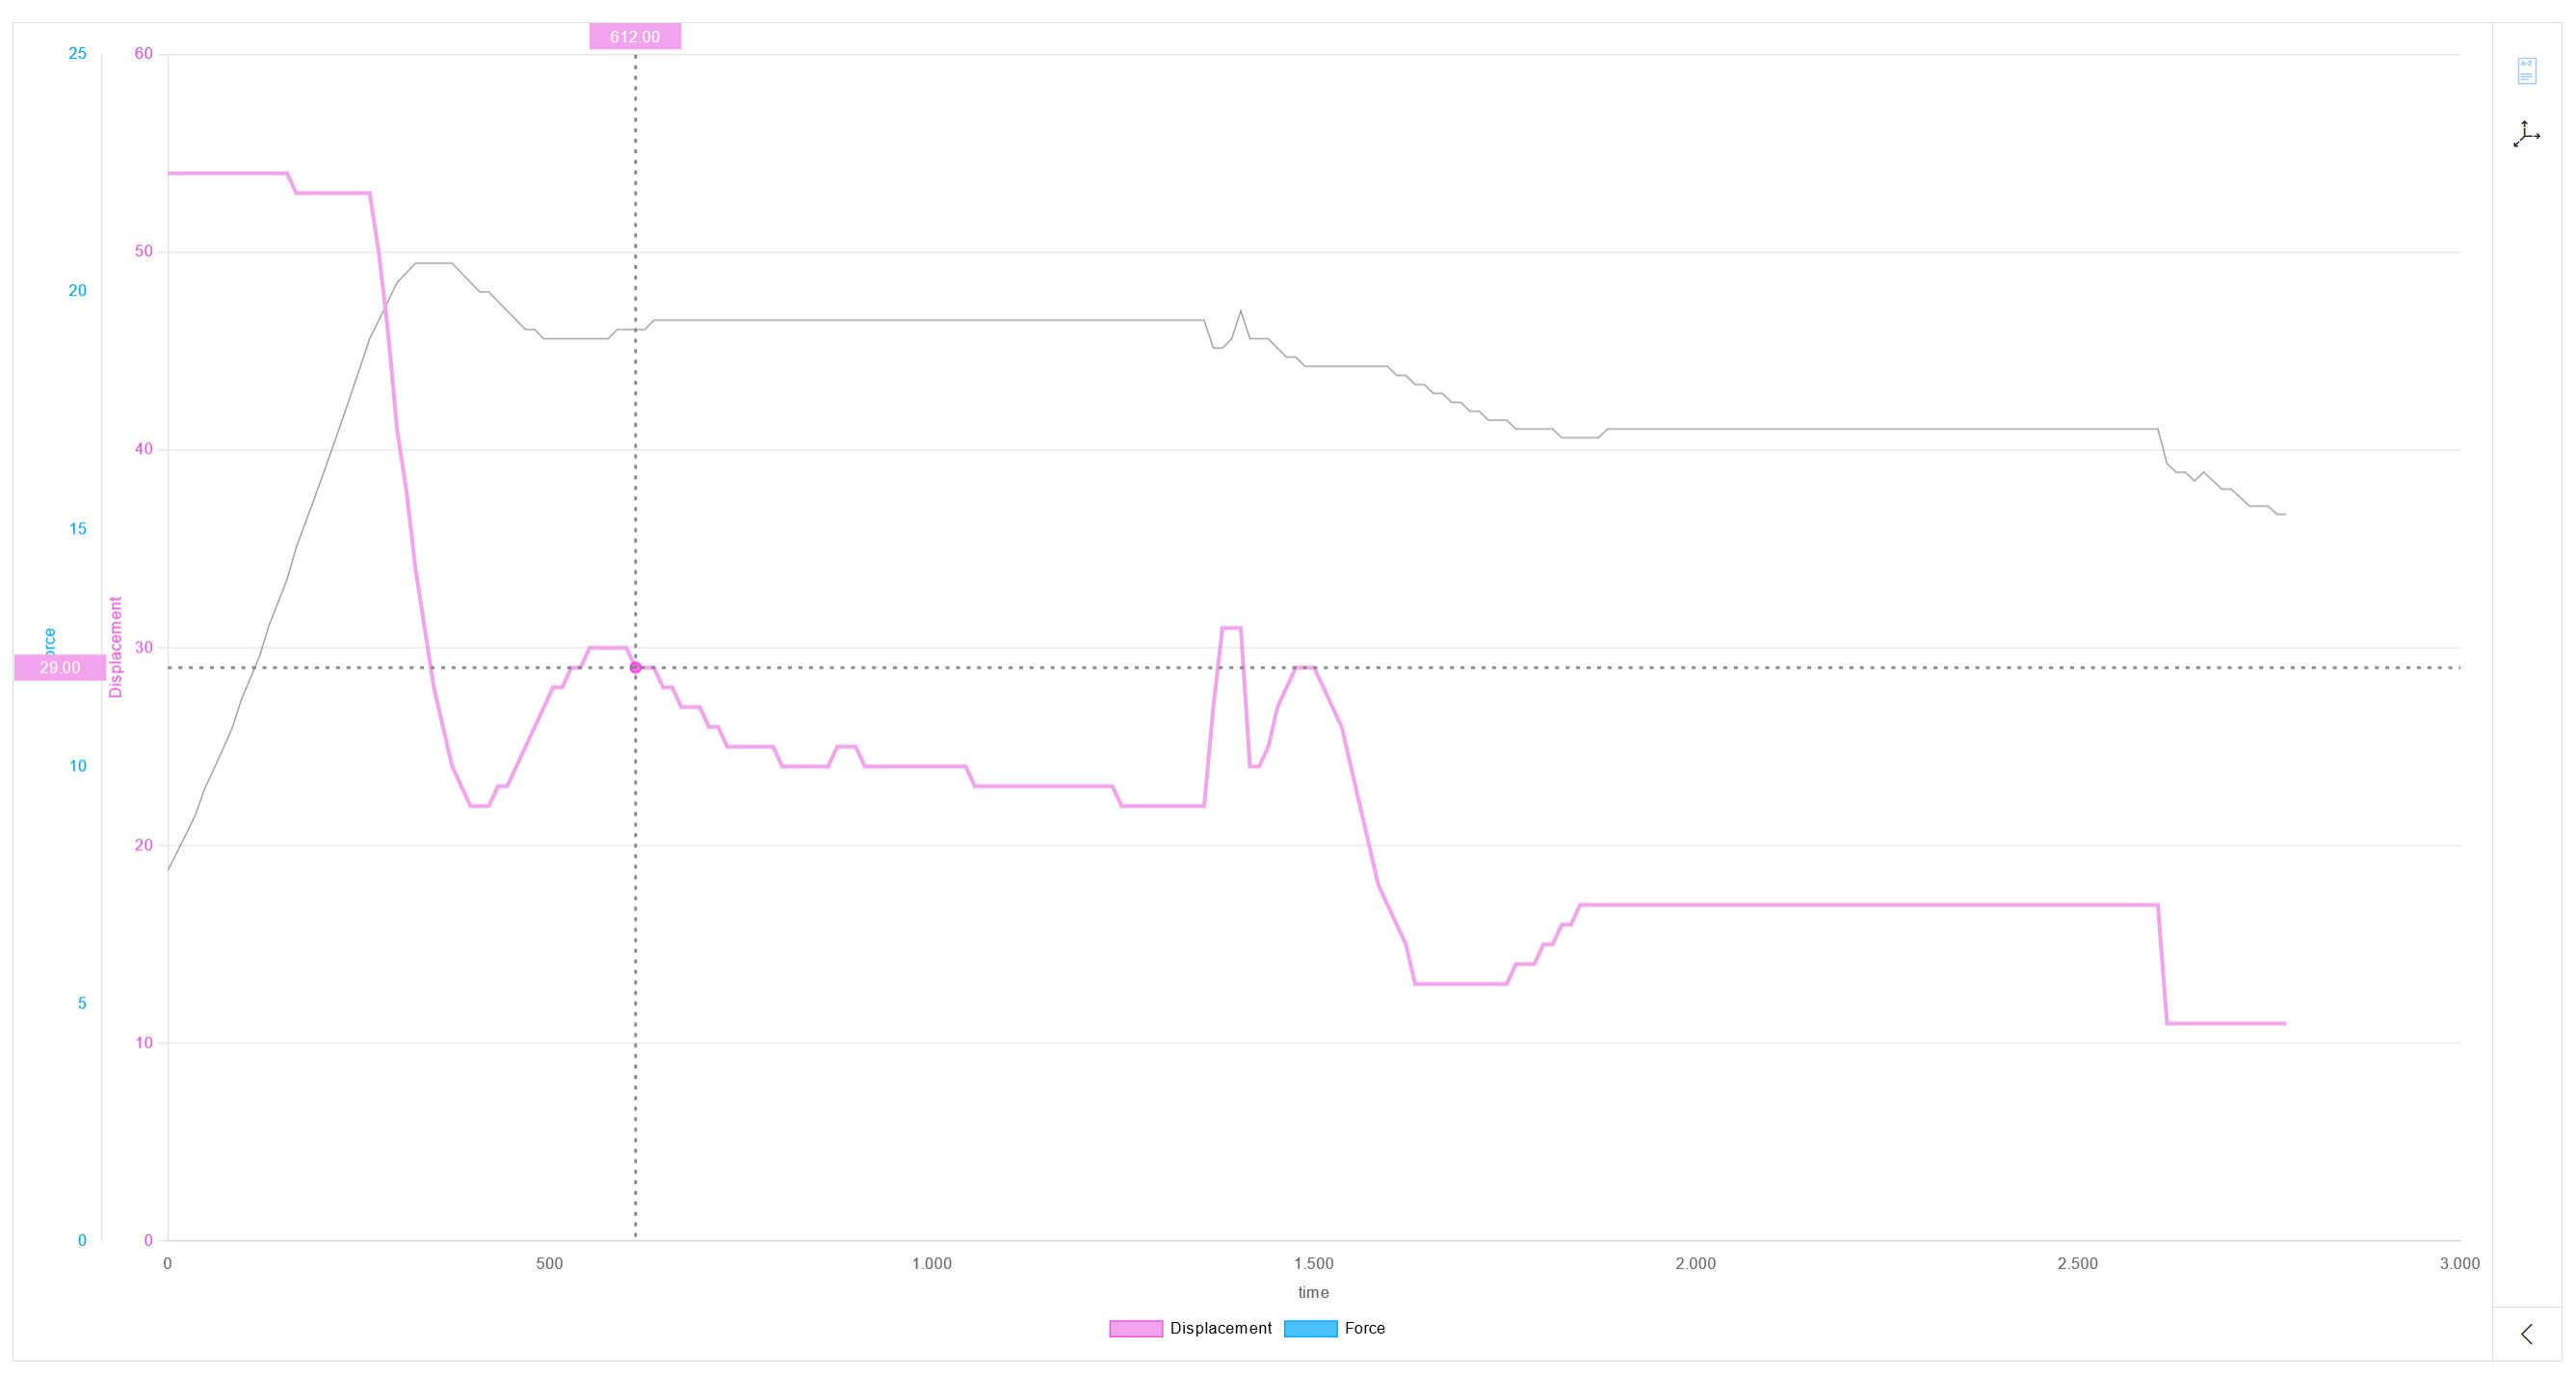
The process curve is highlighted. All other diagram elements change to gray.
The measured values of the X-axis and Y-axis are displayed in the color of the corresponding process curve.
In comparison mode, all process curves of the process are highlighted: Compare Processes