![]()
![]()
![]()
![]()
|
|
|
|
|
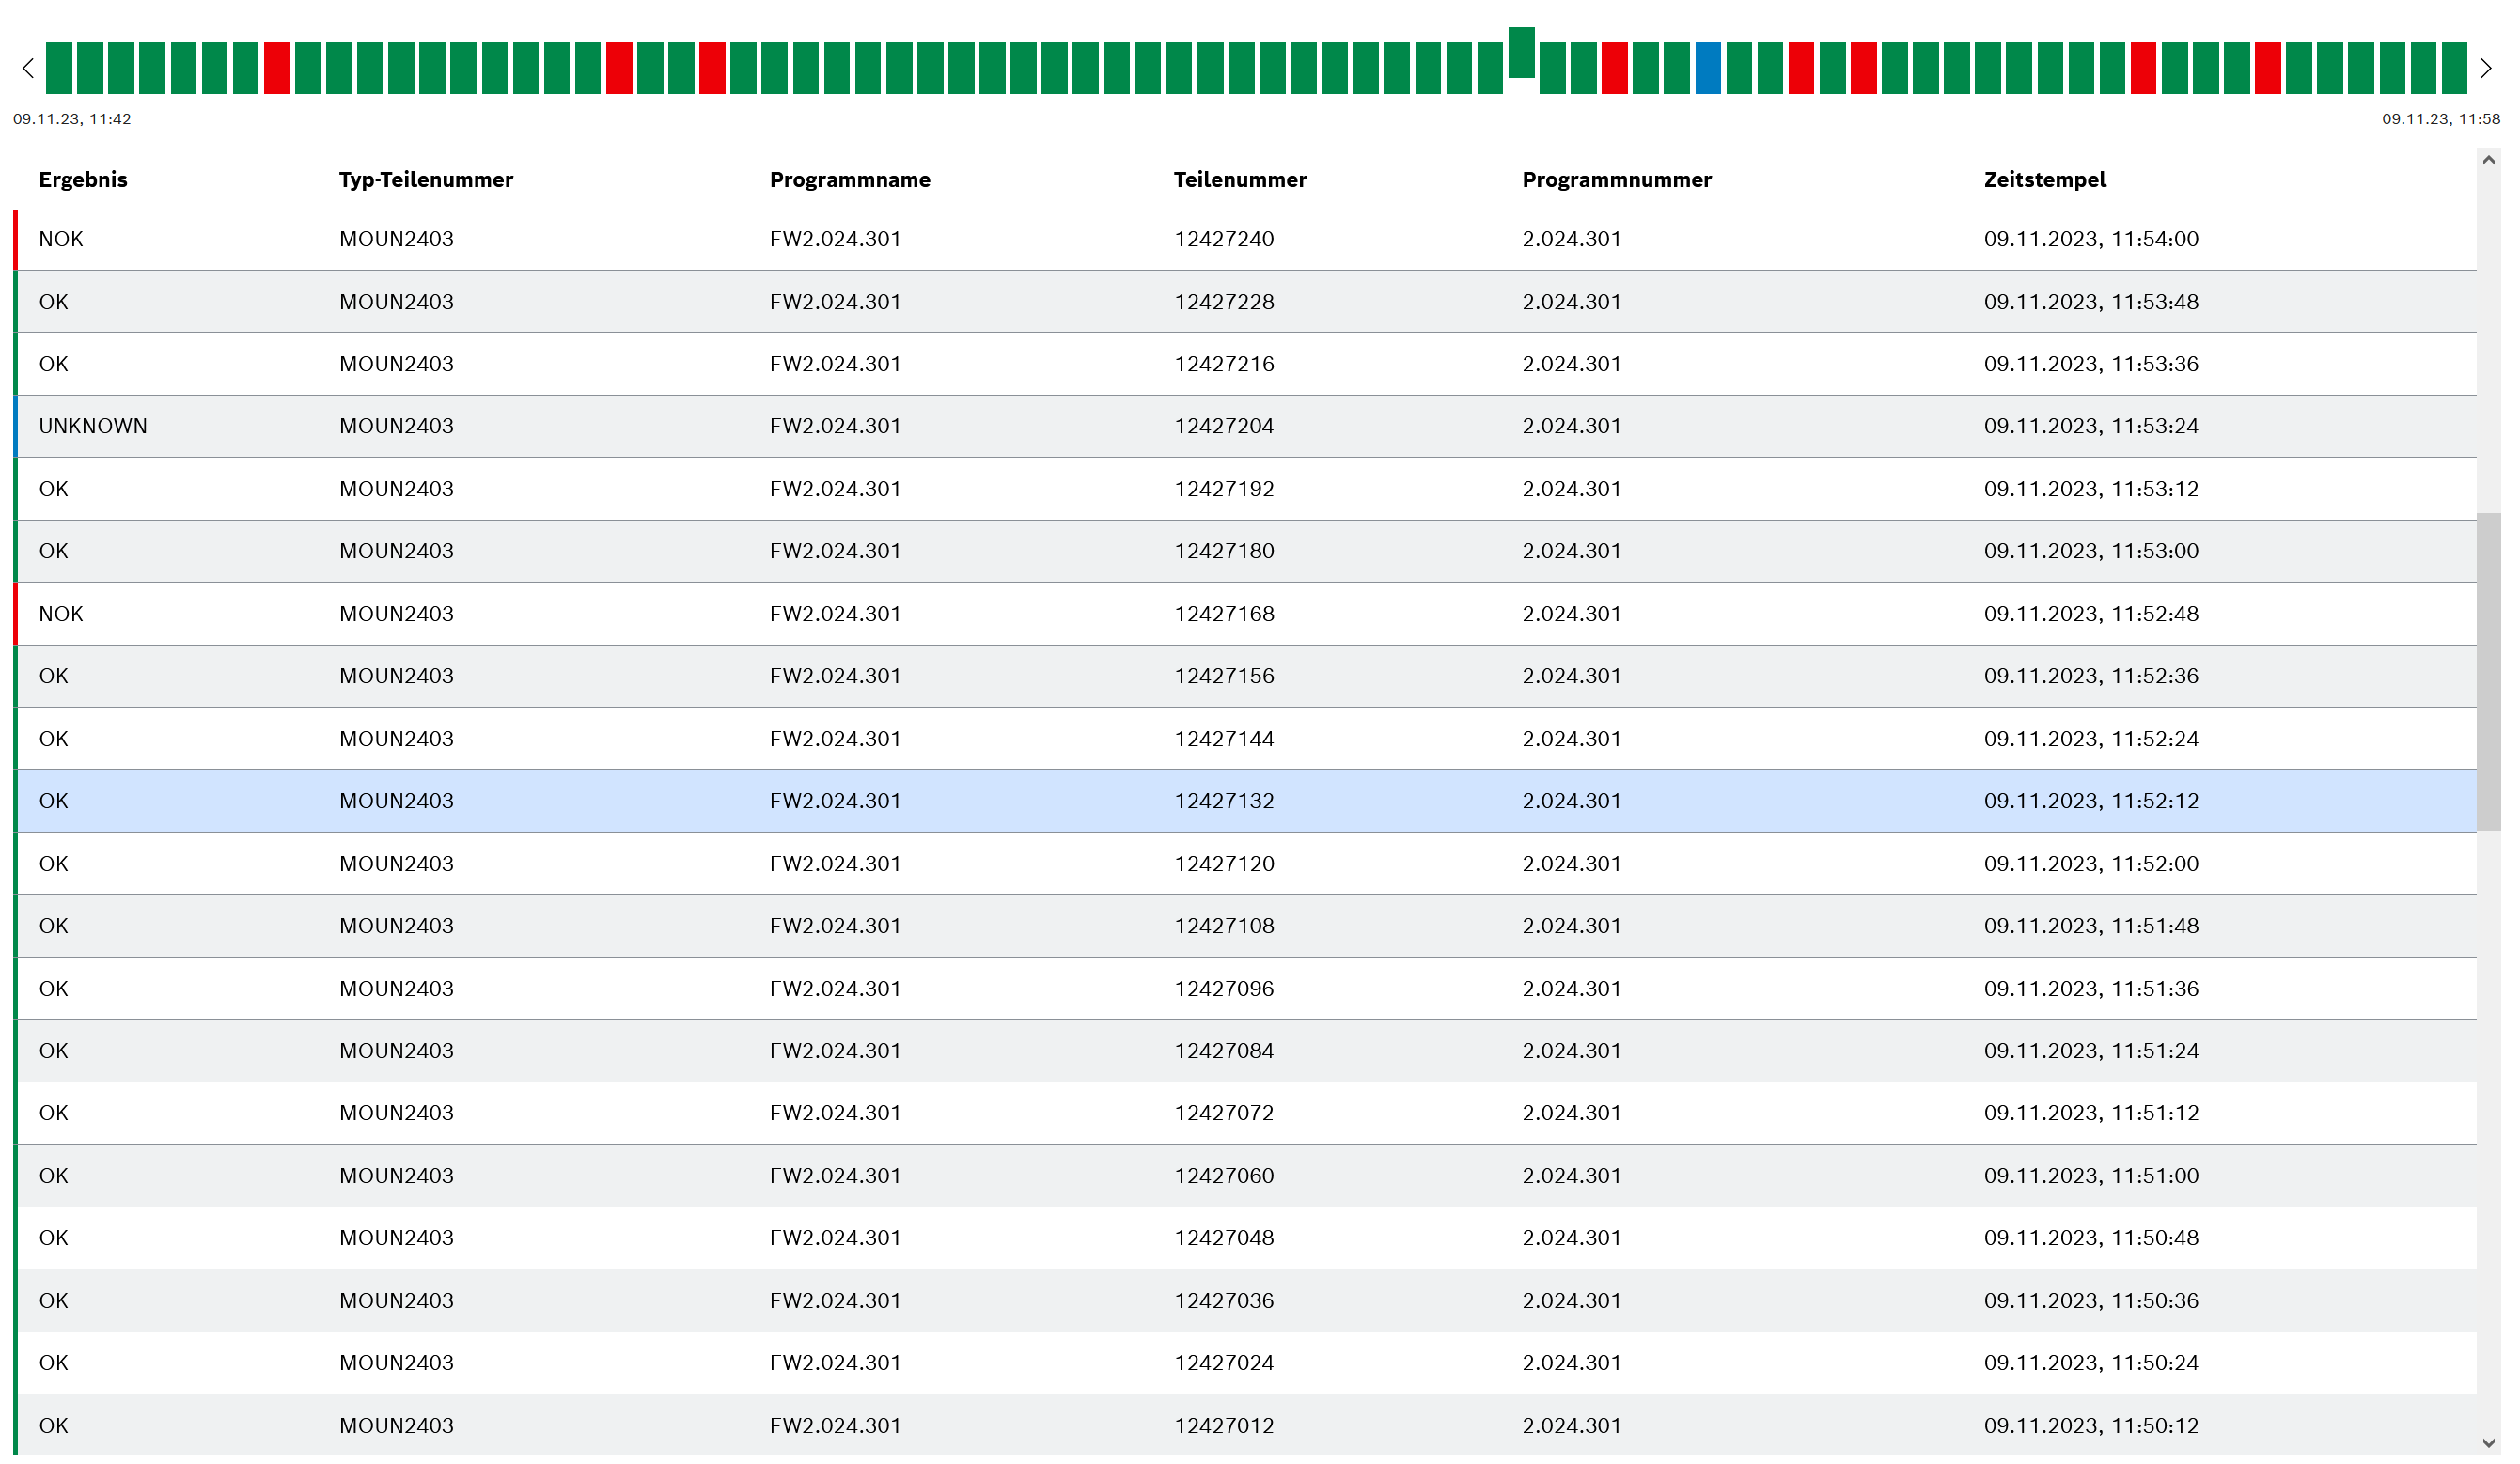
The process data for connected devices is displayed in the menu under Process quality. The device data can be analyzed in two views:
The following functions are available in these views:
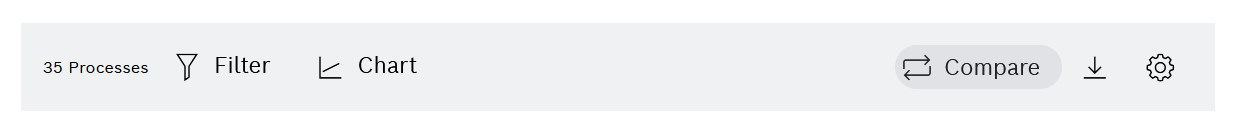
Header
Icon |
Function |
|---|---|
|
Switch between list view and diagram view |
|
|
|
|
|
|
|
Status bar
Icon |
Function |
|---|---|
|
Navigate within the time range |
|
If a process is moved upward, it is selected. |
|
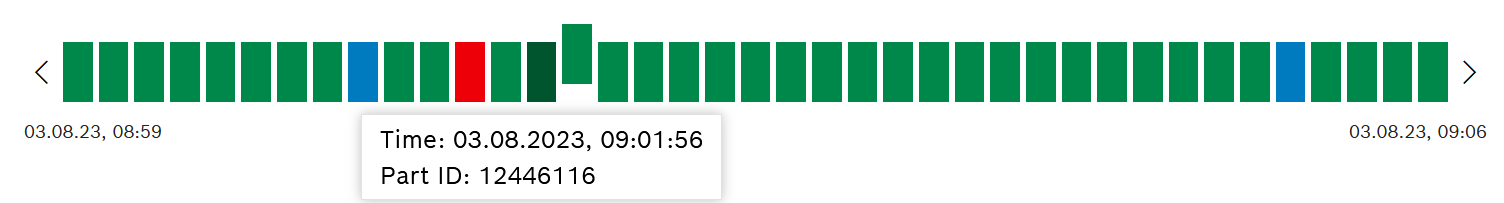
Each process is represented by a rectangle in the status bar.
|
|
To improve comparability: Shows the connection between the process curve highlighted in the diagram and the position in the status bar. This function is only available in the |
Move the mouse over the process
|
Display time and part number of process |
Anomaly detection is only available if the Process Intelligence add-on has been activated. Special roles and authorizations are required for this: Introduction to the Process Quality module
Panel
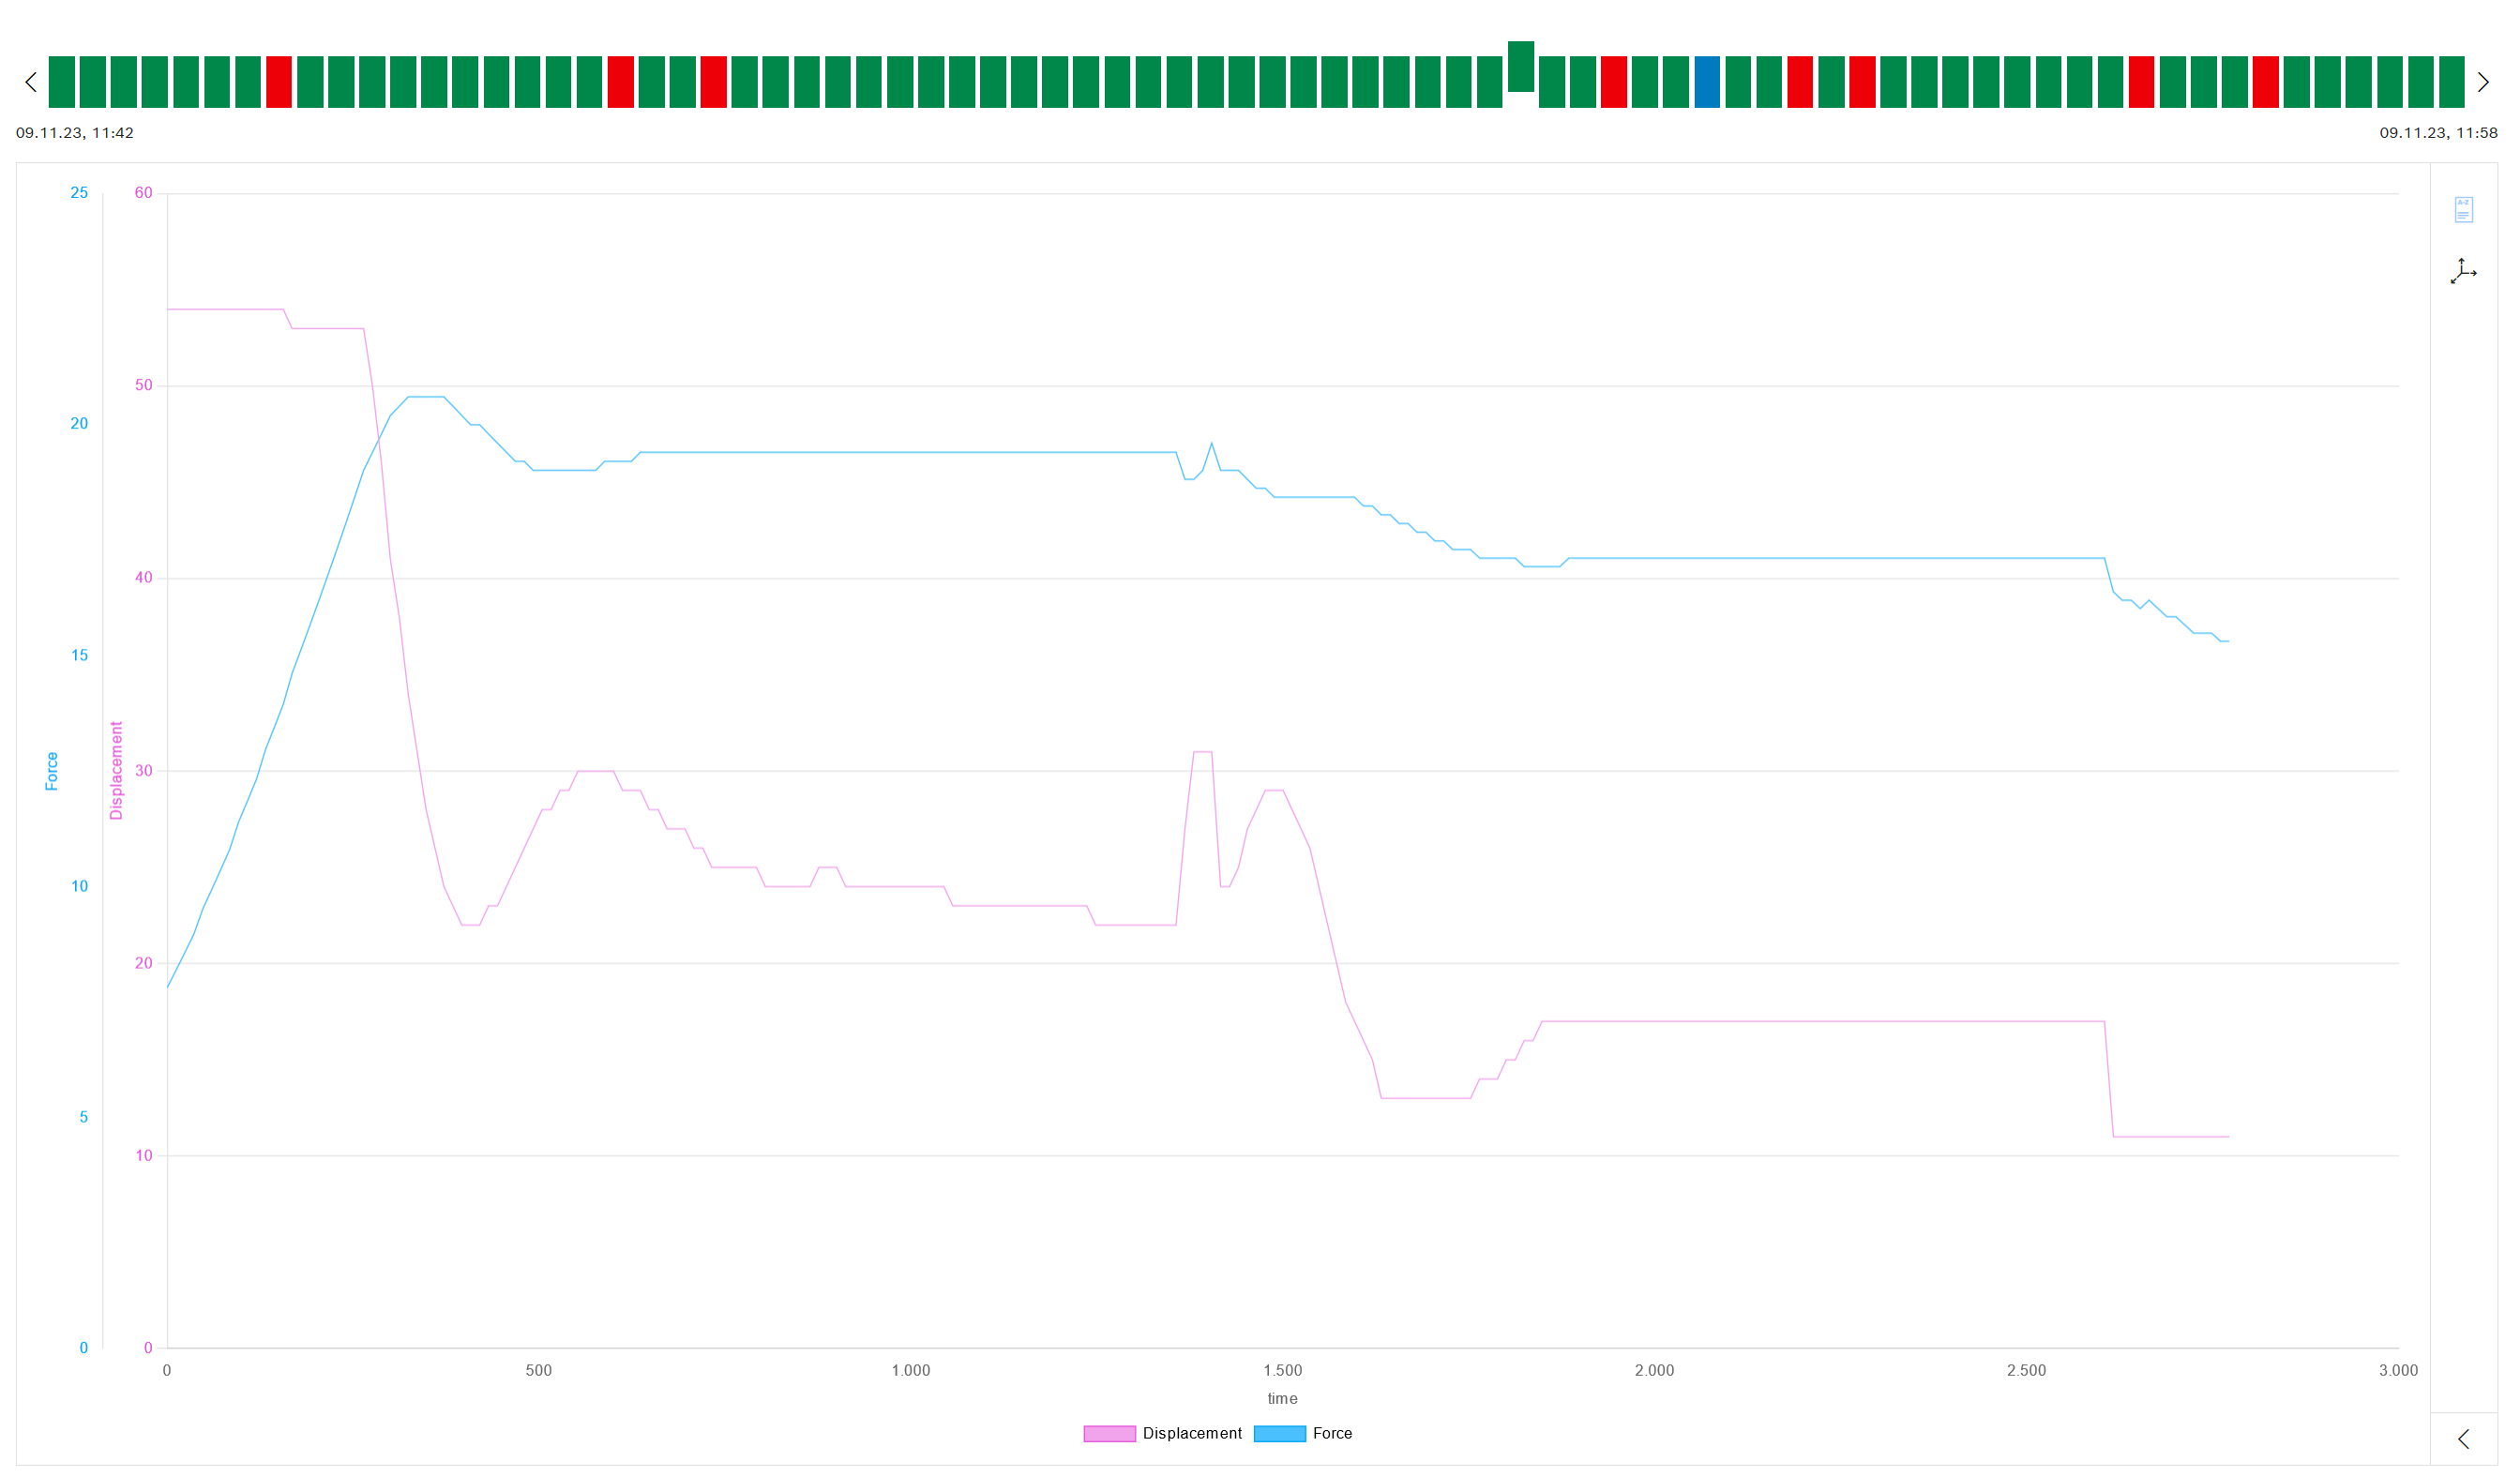
The panel is only available in the diagram view.
Icon |
Function |
|---|---|
|
|
|
Show or hide legend |
|
|
|
|
|
Reset zoom (Enlarge diagram content) |
|
Zoom in (Enlarge diagram content) |
|
Zoom out (Enlarge diagram content) |
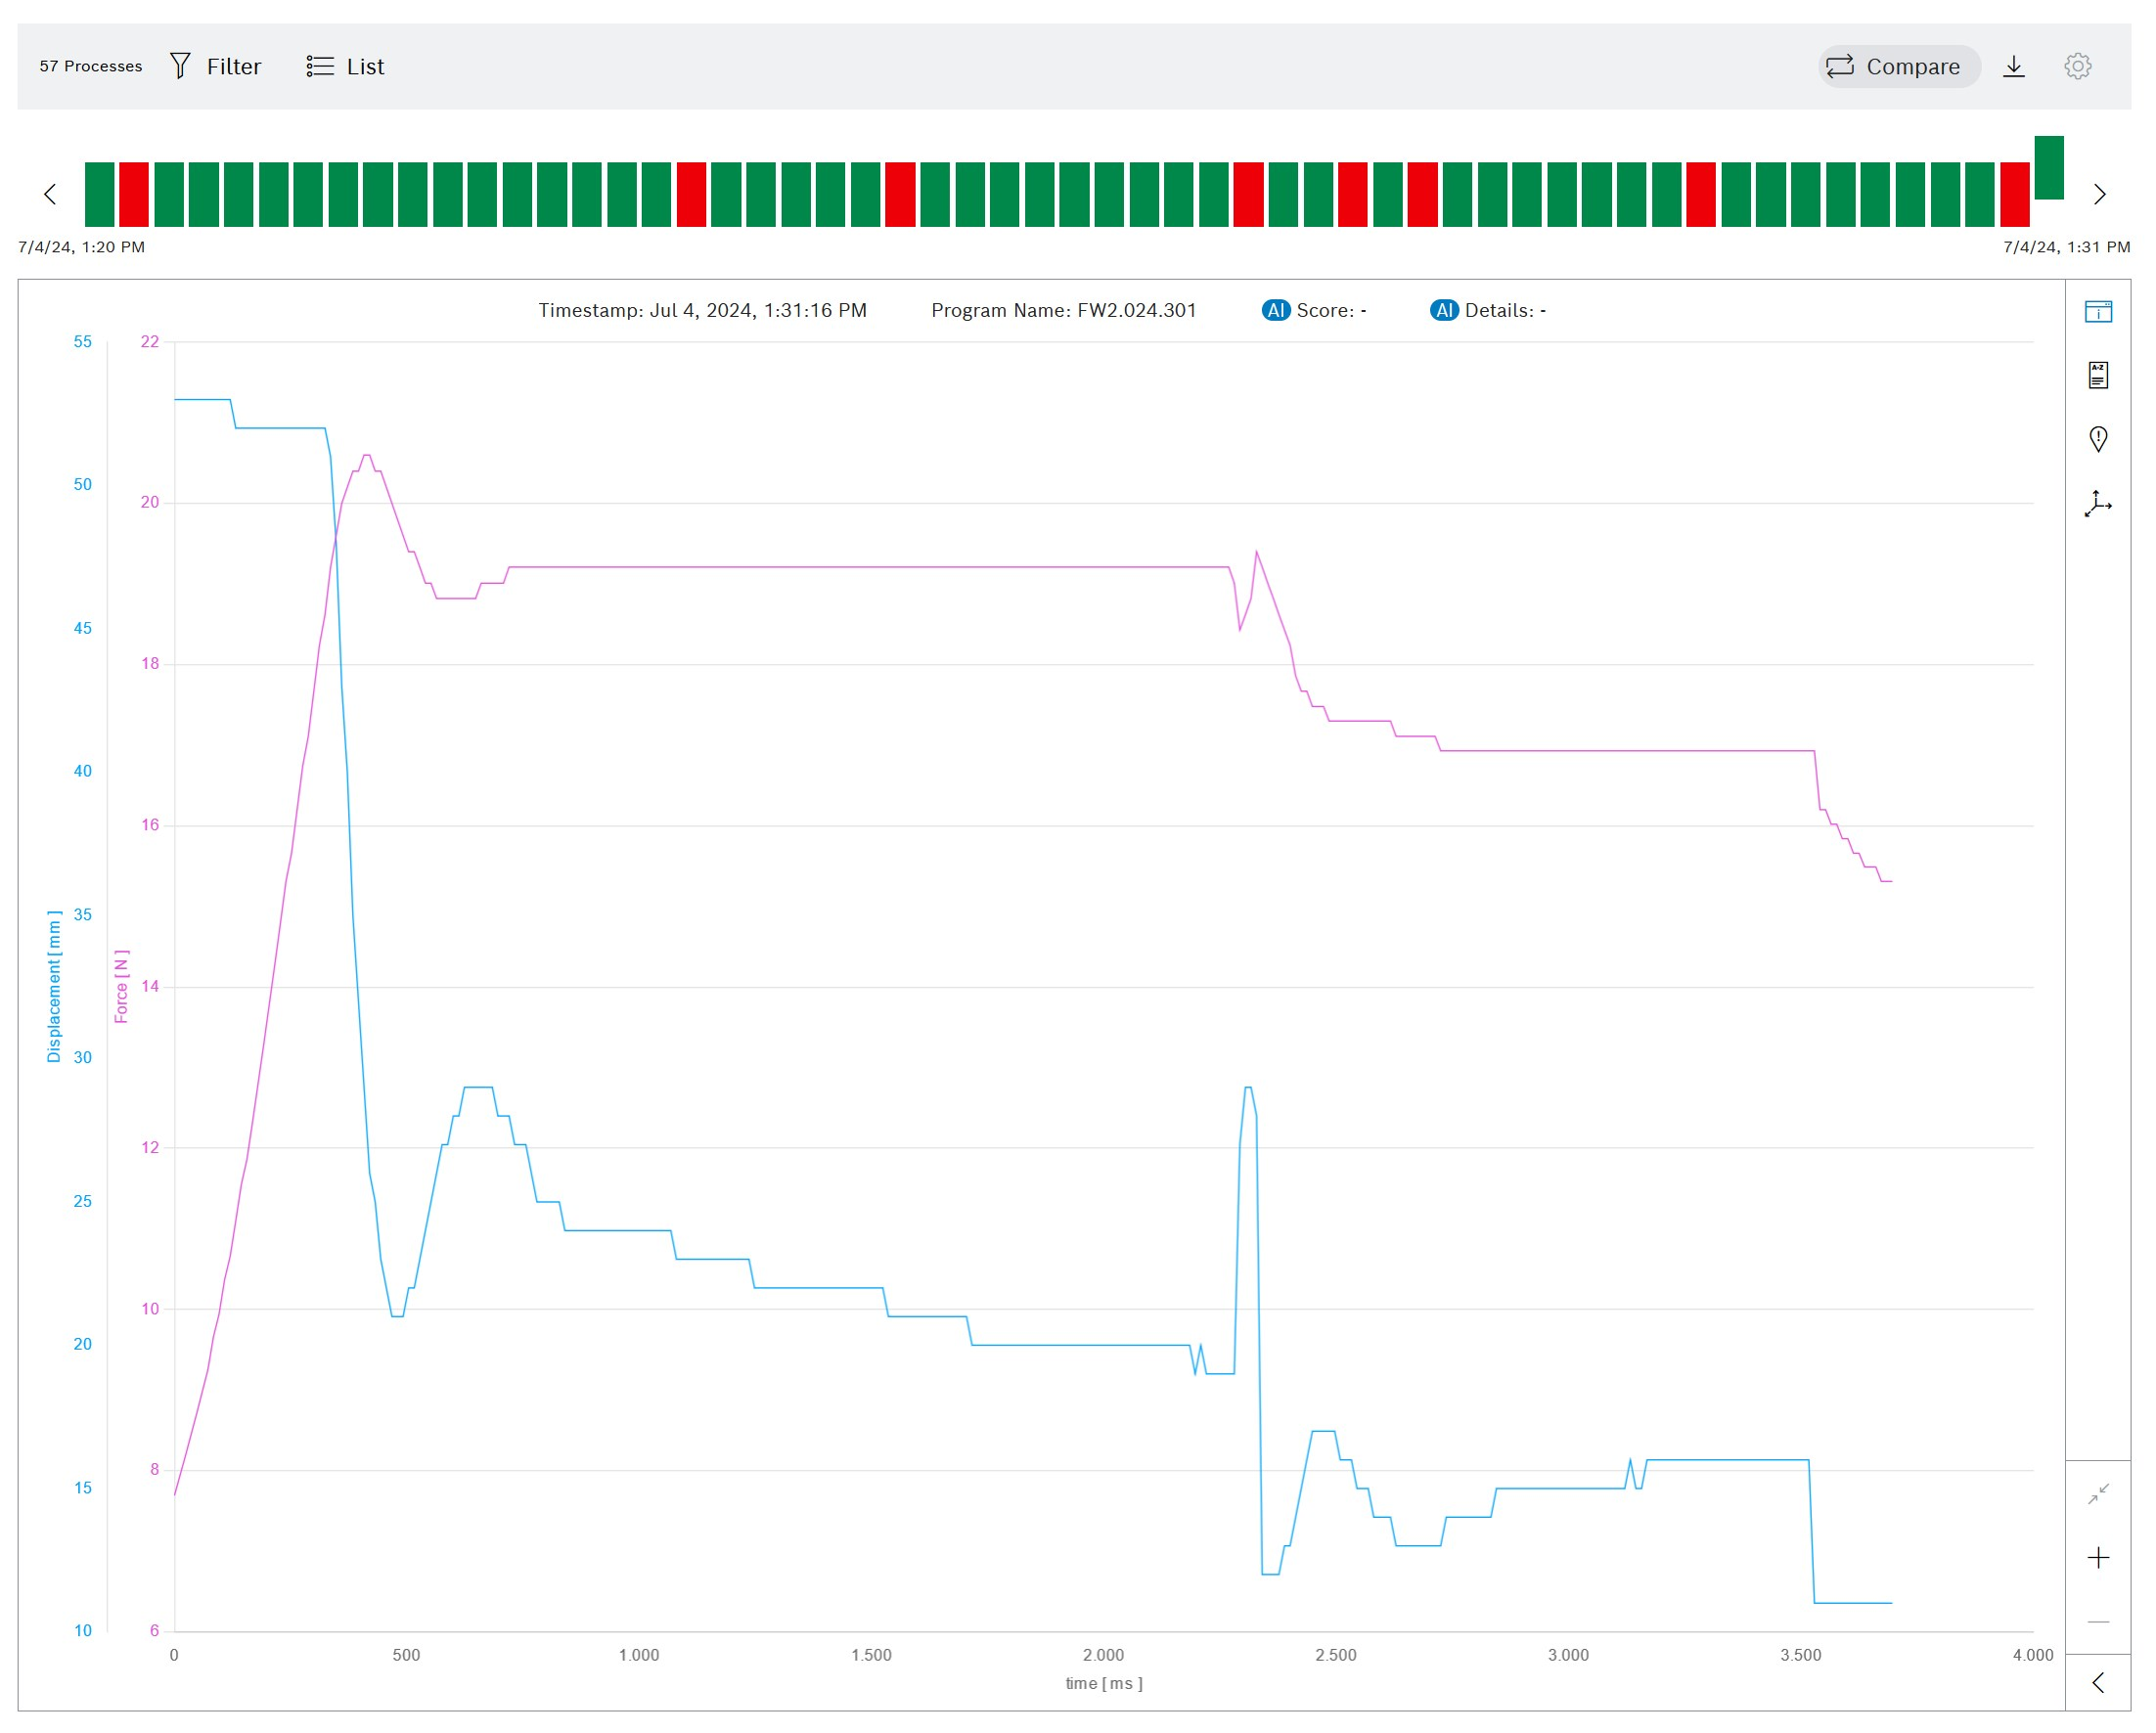
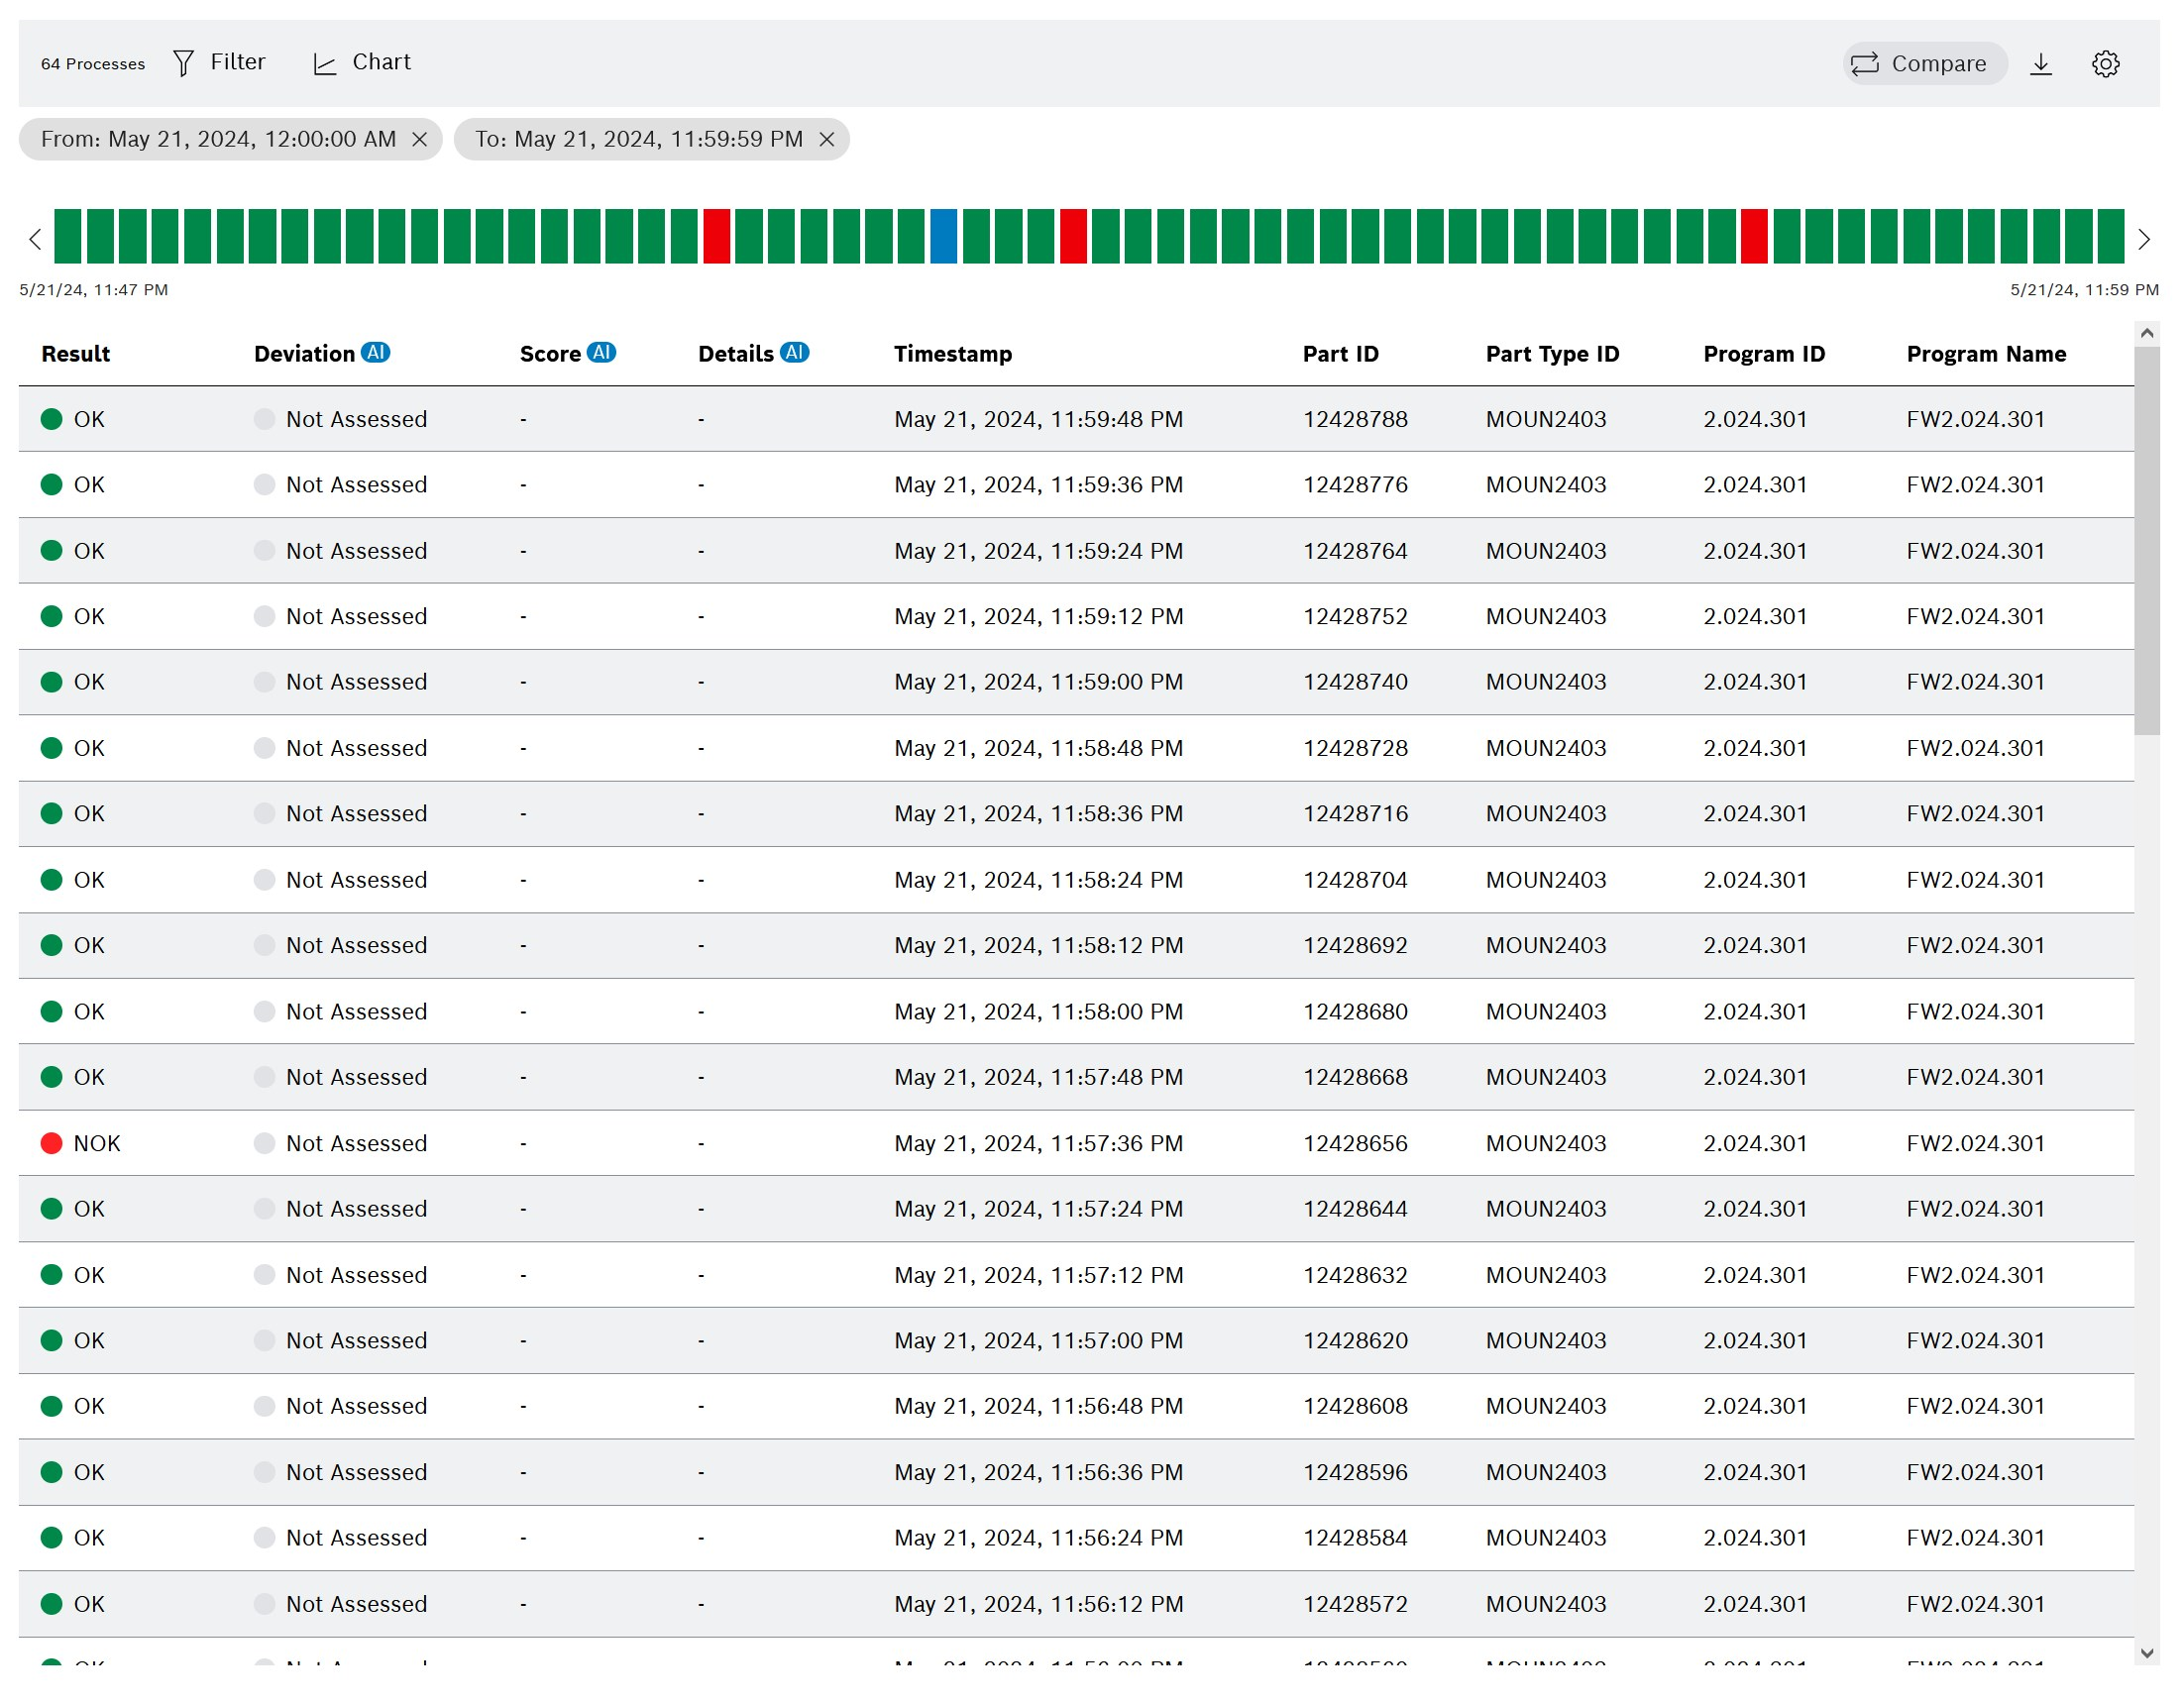
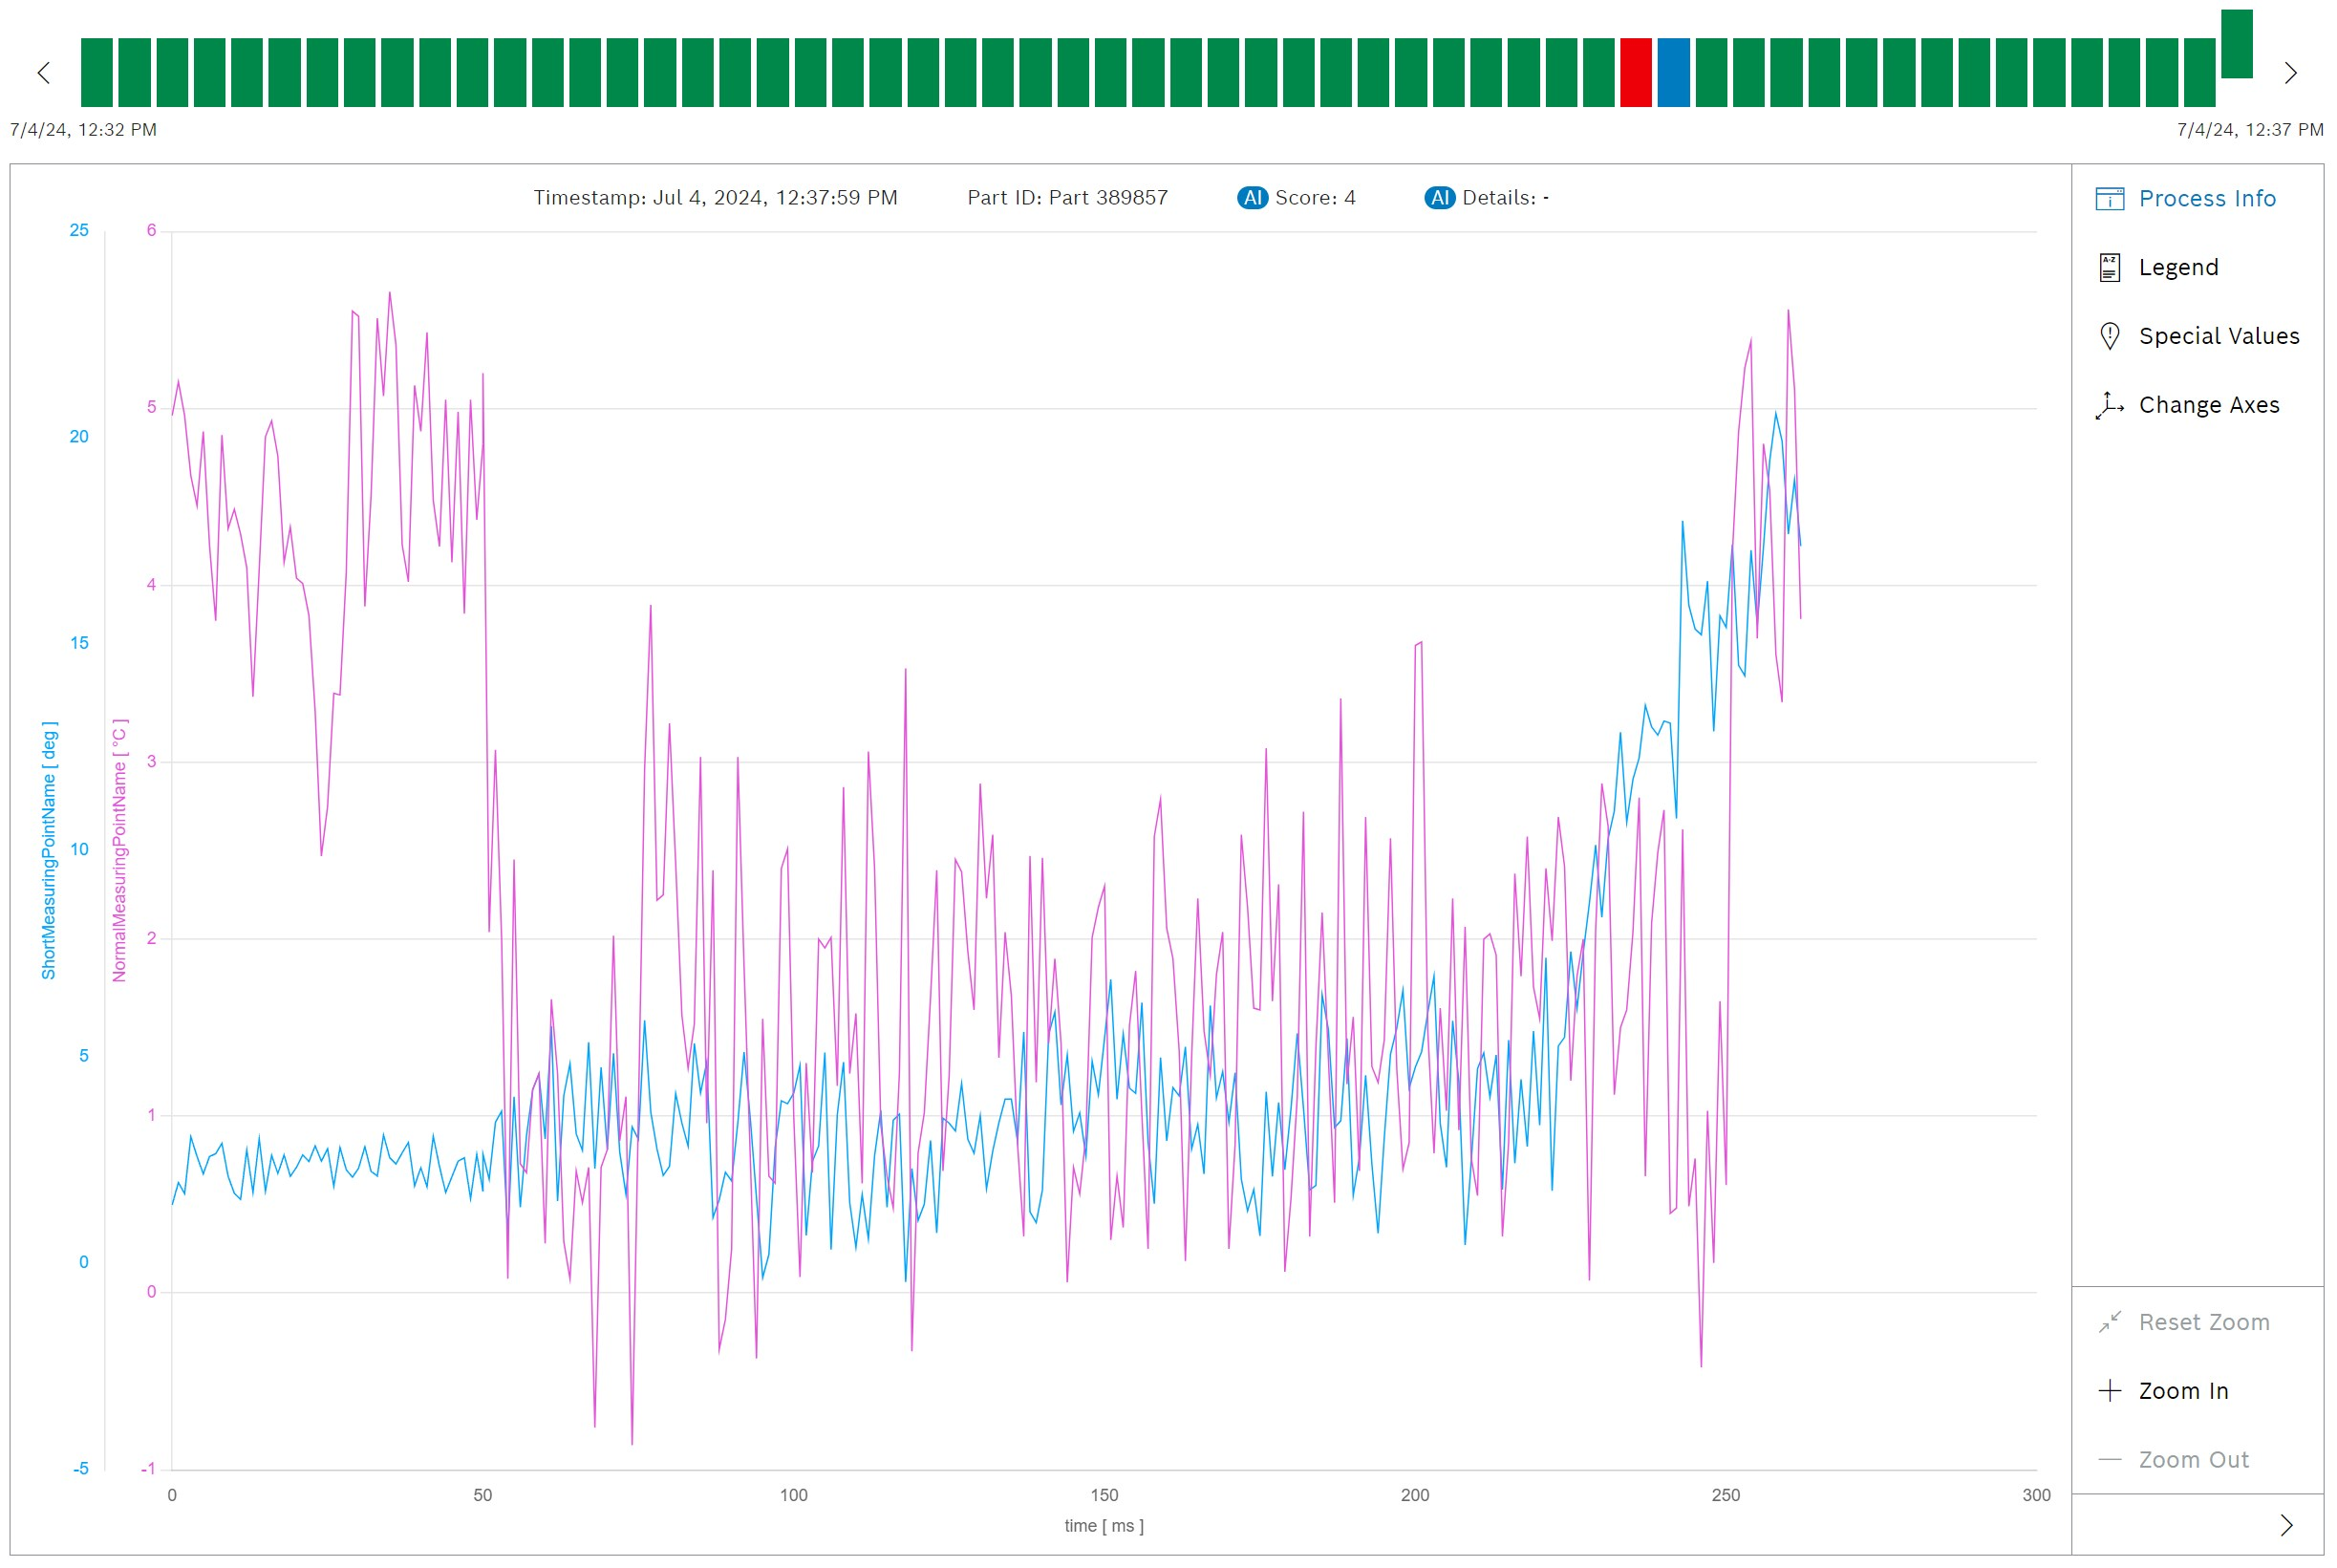
For displaying the measured values of a process in the diagram or process data in the list.
Prerequisites
Two measuring points are required for the diagram view, however. Measuring points are defined in the Master Data Management module.
Procedure
5. Select process:
The selected process is moved upward in the status bar.
The process curve is displayed in the diagram.
In the list, the selected process is displayed in the visible area and is marked in blue.
If comparison mode is activated, the last selected process is displayed in the visible area: Compare Processes


 or
or