A process curve can be temporarily highlighted to keep track of multiple processes. With temporary highlighting, the corresponding process curve is displayed prominently in the diagram.
In comparison mode, the temporarily highlighted process curve is also marked in the status bar.
Prerequisites
Process Quality User or Process Quality Expert role
At least two measuring points are defined for the selected device type.
Two measuring points are required for the diagram view, however. Measuring points are defined in the Master Data Management module.
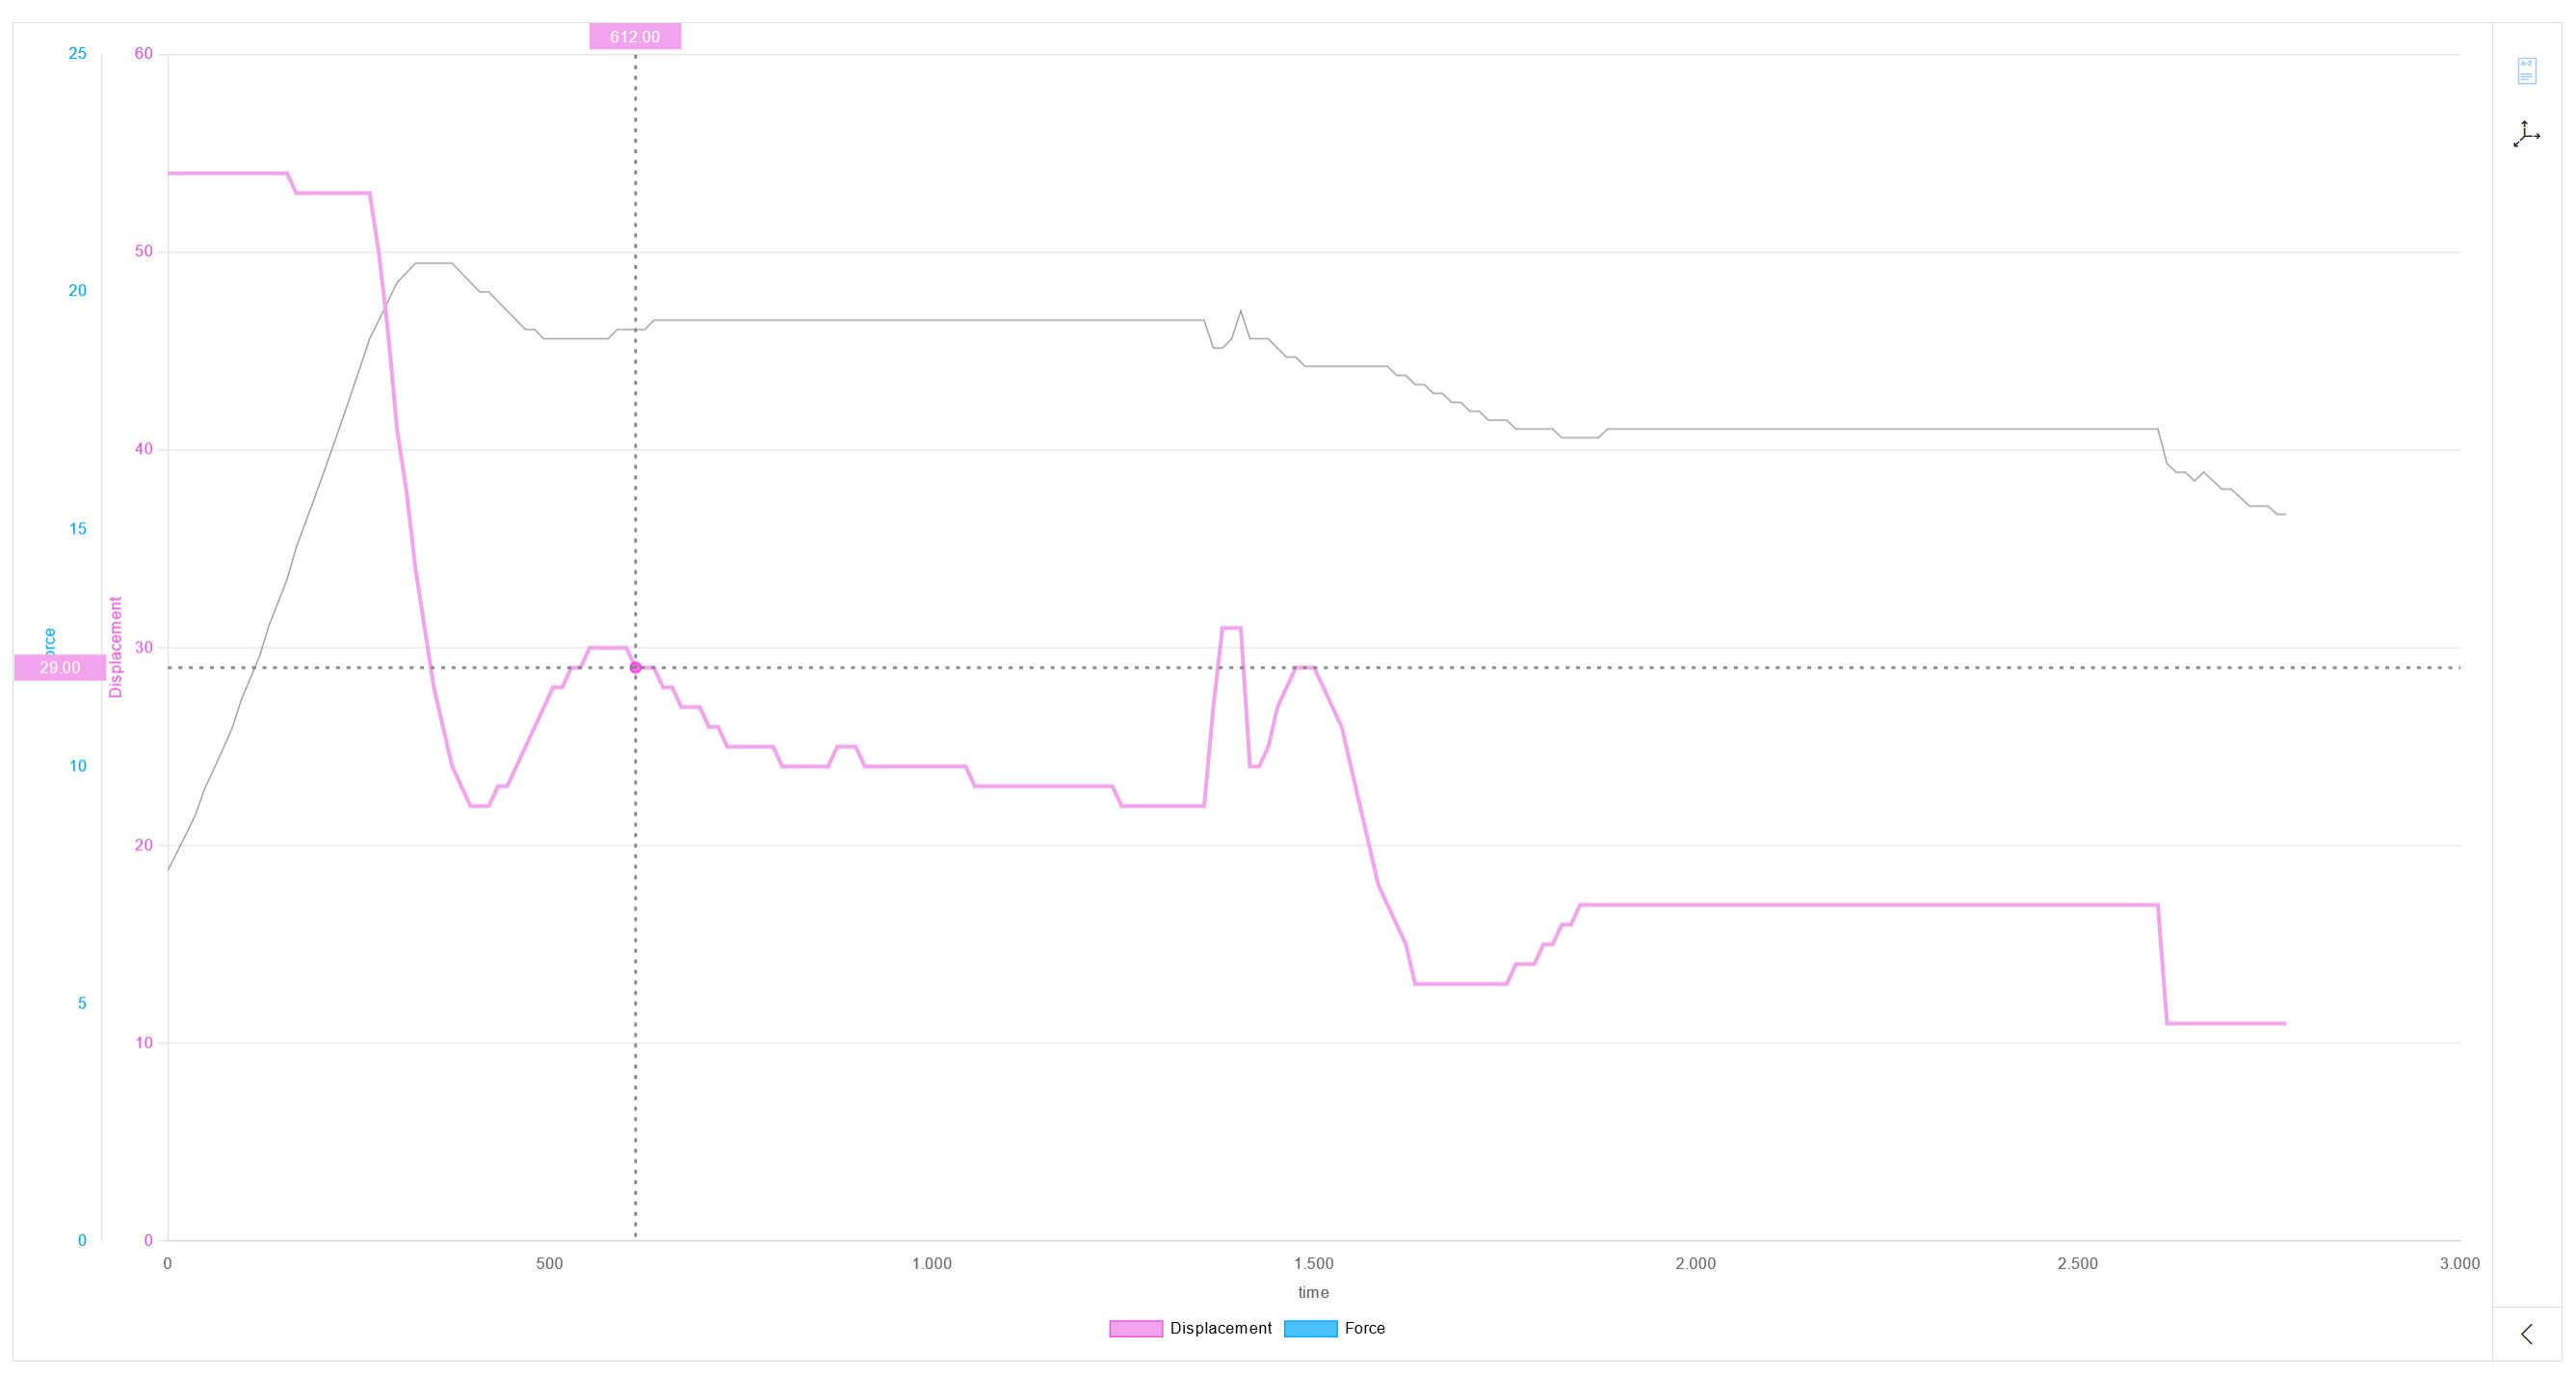
Move the mouse over the process curve in the diagram.
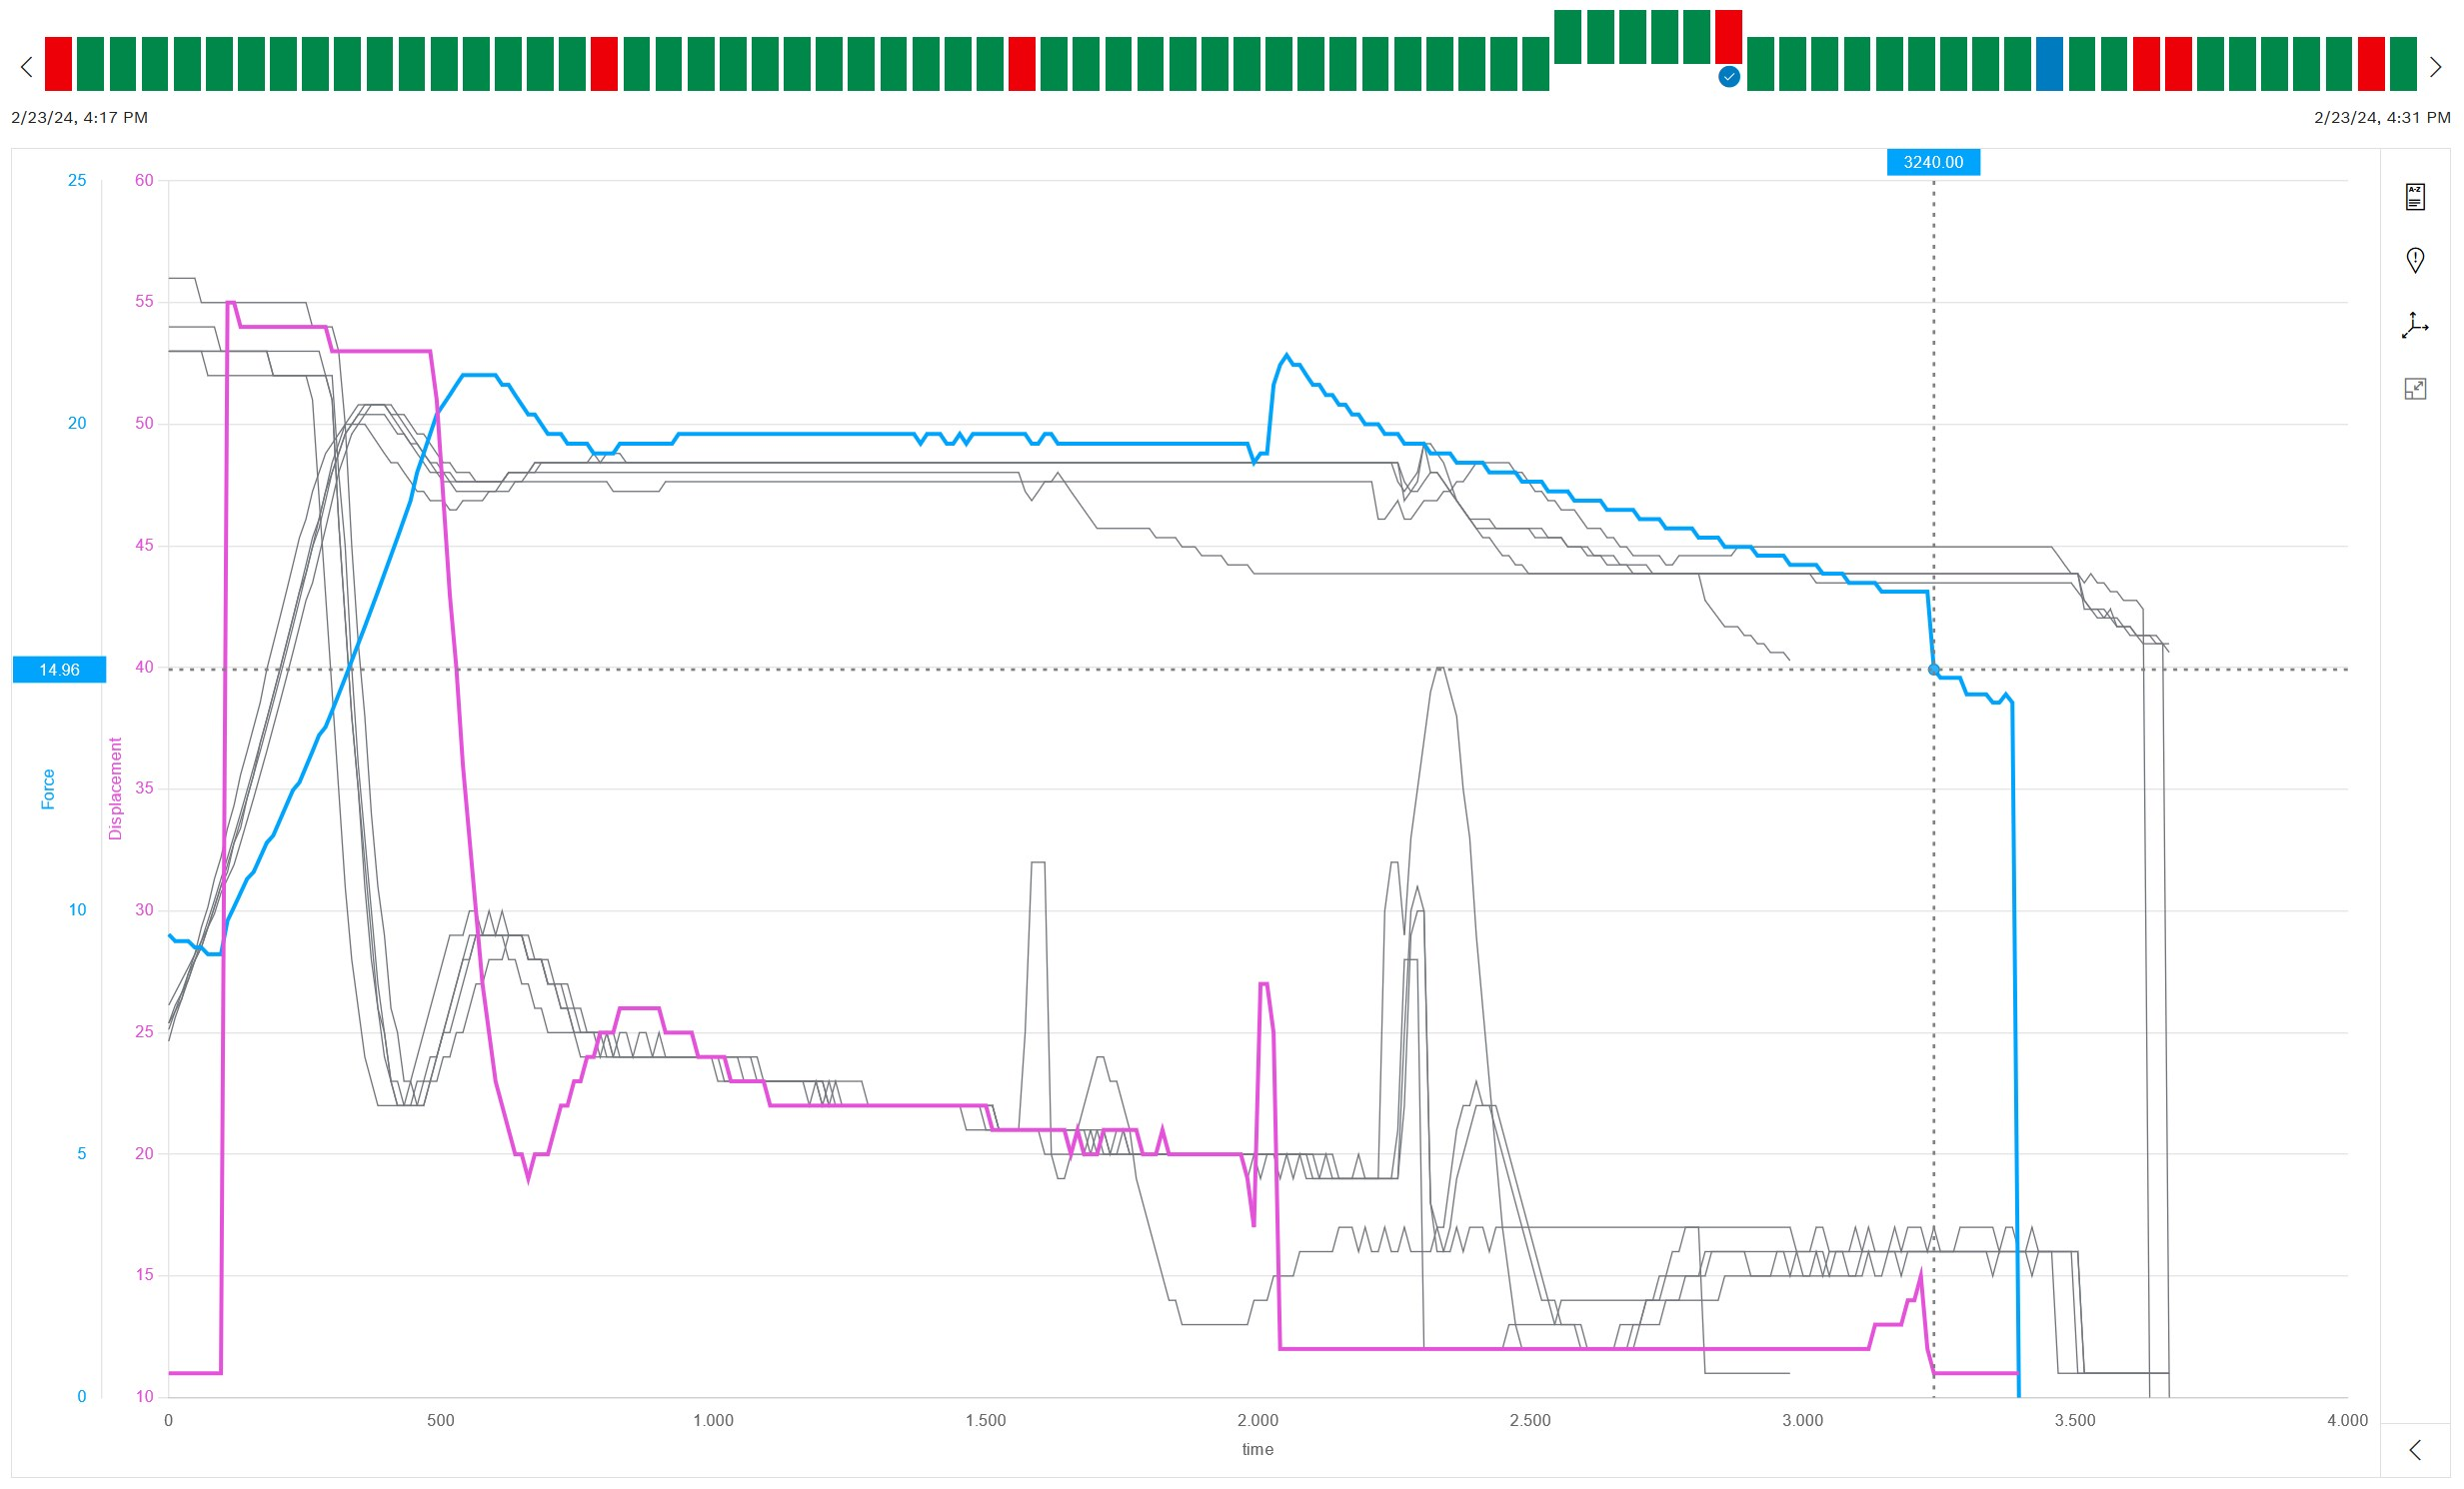
Option 2 (comparison mode active):
Move the mouse over the process curve in the diagram or over the desired process in the status bar.
The process curve is highlighted. All other diagram elements change to gray. The specific measured values are displayed: Display measured values in the diagram
If the comparison mode is active (Compare processes), all process curves of the selected process are highlighted. The process to which the highlighted process curves in the status bar belong is indicated by .