Some process data that is displayed in the list view can also be displayed in the diagram view. By default, two items of process data are displayed in the diagram view. A maximum of four process data values can be displayed.
Prerequisites
Process Quality User or Process Quality Expert role
For anomaly detection: Process Intelligence (PQM) role
In the panel to the right of the diagram, click on Process information.
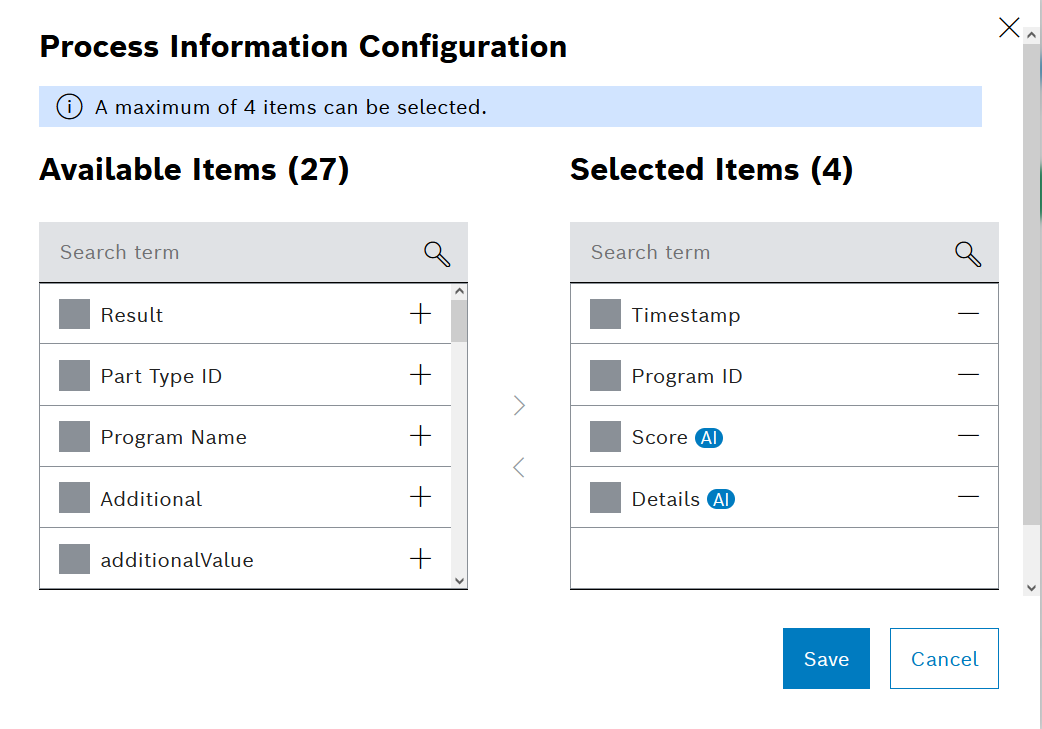
In the Configure process information dialog window, select the elements to be displayed in the diagram.
To change the order of the process data (elements) in the diagram view, drag and drop the entries. The first entry is displayed in the diagram on the left.
Accept the changes with Save.
The process data of the selected elements is displayed in the diagram.
If more than one process is selected in comparison mode, no process data values are displayed. Compare Processes