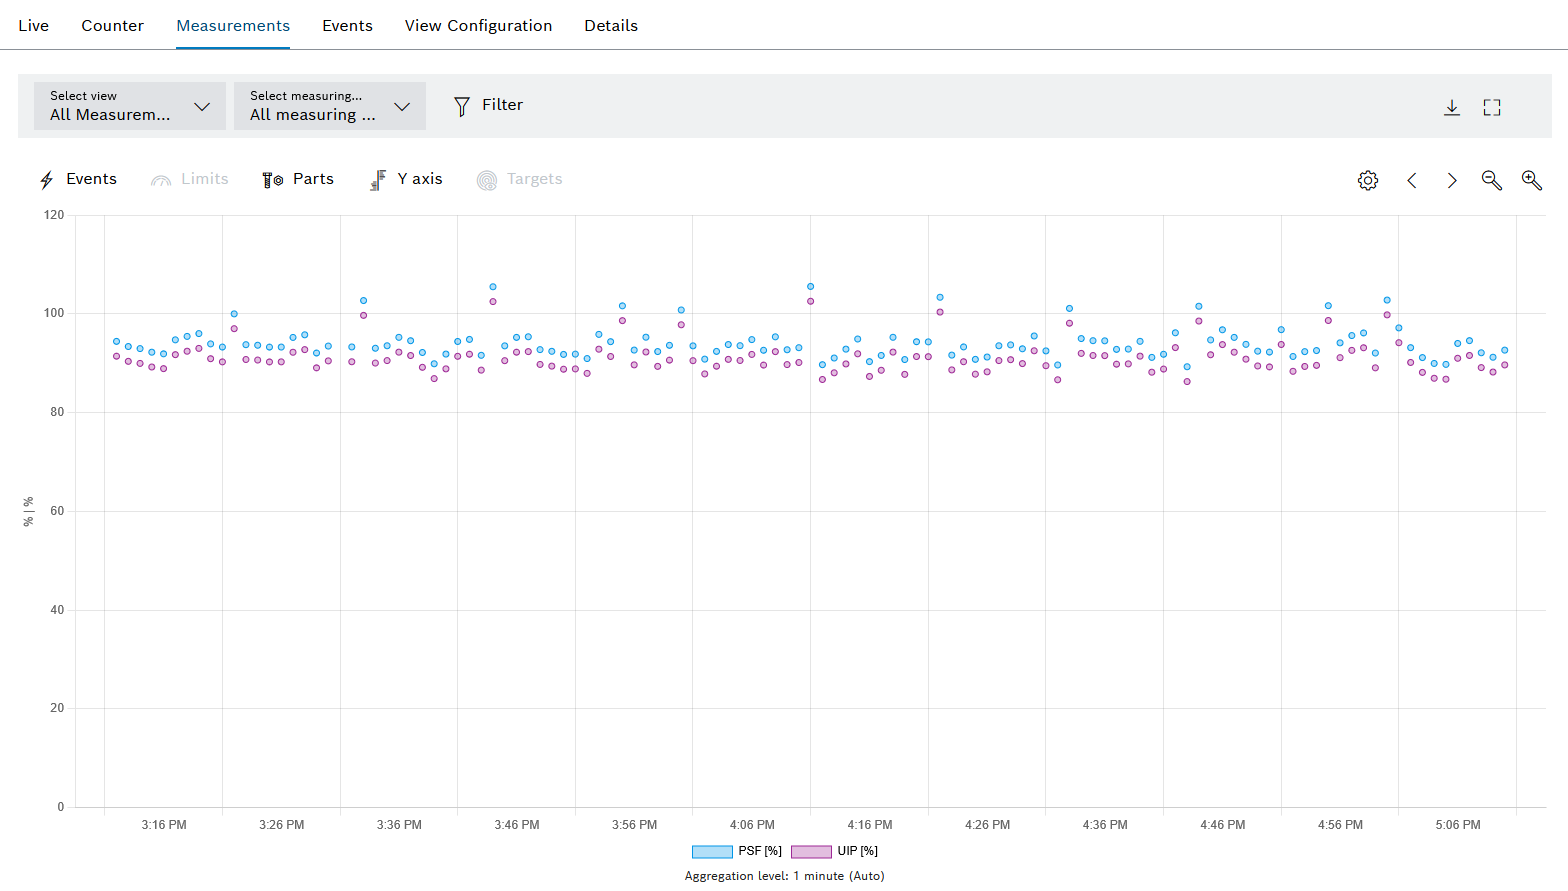
If a device is selected in the Efficiency analysis > Condition monitoring menu, the detailed view opens. Older measurement data for the device is displayed in the detailed view in the Measured Values tab.
Element/icon/column |
Description |
|---|---|
Select view |
Select a view from the drop-down list. The drop-down list displays all the device views created from the View Configuration tab. All measuring points Display all measuring points of the device. |
Select Measuring Point |
Select the measuring point to be displayed from the drop-down list. The drop-down list displays all created measurement points for the device. All measuring points Display all measuring points of the device. |
|
Filter the overview by selecting the Time Range or Event Code in the dialog window. |
|
|
|
Open full-screen mode. The full-screen mode can be closed with [ESC]. |
|
Show and hide the number of events. |
|
Show and hide limit values from the measured value messages. Limit values are only available with the setting Aggregation level — Raw data (max. 10,000 measured values). The setting can be selected in the aggregation settings. |
|
Show and hide the part number, type part number and result of the device. |
|
Show and hide Y axes. |
|
Show and hide setpoint. |
|
|
|
Navigate forward or back by half an hour. |
|
Zoom in and out. To select an area, draw a rectangle with the mouse. |