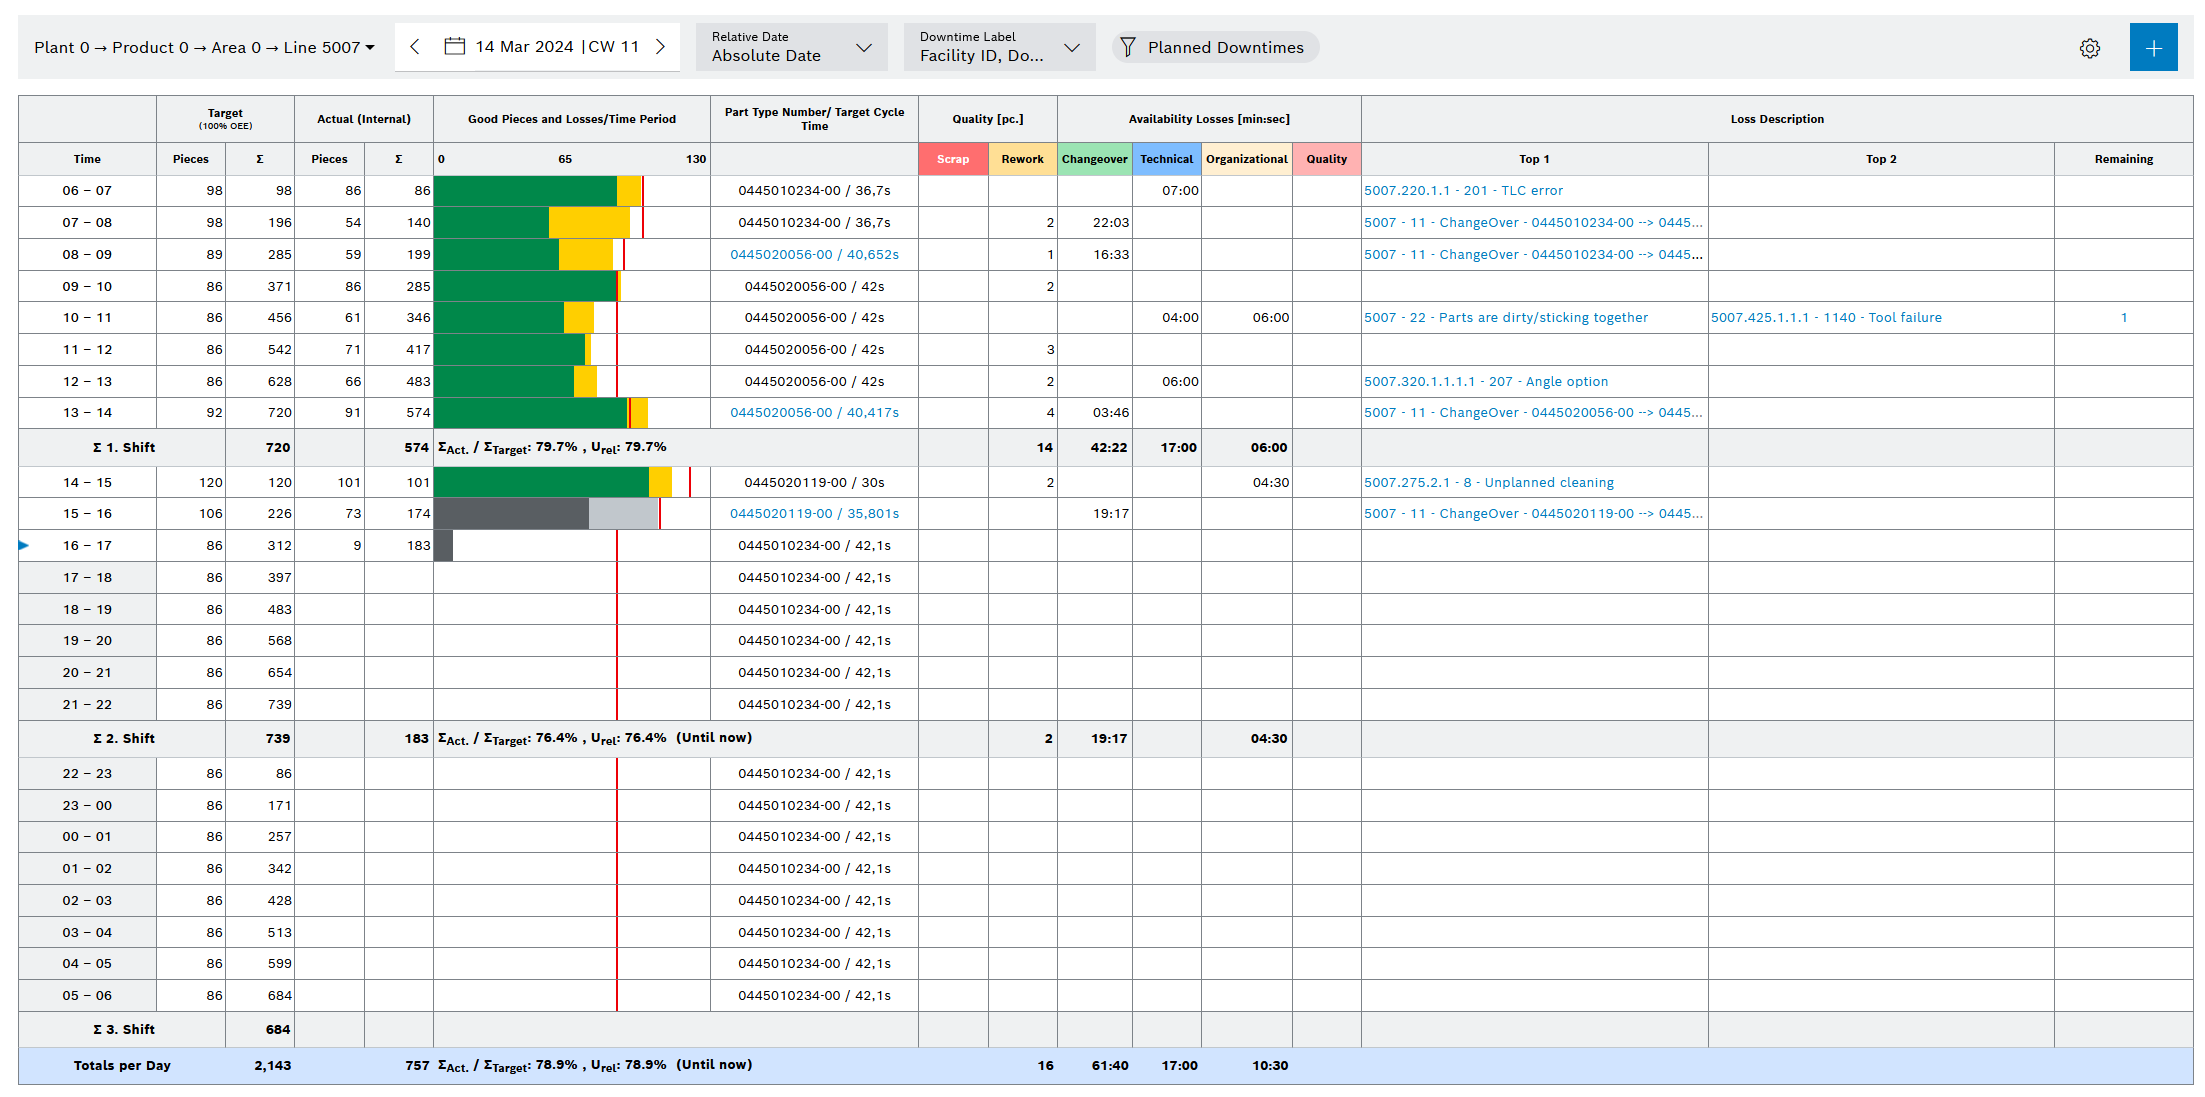
The Hourly Quantity Tracking interface is structured as follows:
Hourly data is listed for each shift in the day:
Element/Icon |
Description |
|---|---|
Target |
Indicates the Target part counts (equivalent to 100% OEE or the target OEE) as both an hourly figure and accumulated per shift. The target part count is calculated from the current target cycle time (which may depend on the number of workers) and the planned occupancy time during the relevant hour (planned downtimes are deducted from the hour). The Target part count selection based on target OEE or 100 % OEE is set by the Shift Book Admin operator under Shopfloor > Administration > Configuration using the configuration parameter Part count target value. The totals displayed for the target values are shown as rounded values without decimal places and may differ by the value 1 under certain circumstances. The correct values with decimal places are used for all internal calculations. |
Actual (internal) |
Indicates the actual part count, both as an hourly figure and an accumulated figure. The actual part count is calculated from the number of IO processes at the counting station(s) on the line. |
Good parts and |
Graphical display of the actual part count (green: hour confirmed; dark gray: hour not confirmed) and the target part count (red line). The Quality losses and Availability losses (in parts) are superimposed in light red. This indicates whether possible losses from the target part count can be justified sufficiently. Unconfirmed hours are shown in gray (actual part counts) or in light gray (losses). Only if part count confirmation is activated. Hourly quantity tracking tab The Shift Book Admin operator must set the maximum number of parts per hour (graphic scaling) under Shopfloor > Administration > Configuration using the configuration parameter for the Maximum number of parts. |
TTNR/target cycle time |
Indicates the Produced type and its Target cycle time. If more than one type is produced per hour, the type produced for longest during this hour is displayed. The other types can be displayed by clicking the red triangle or the row text (similar to Excel). |
Quality [pcs.] |
Display of scrapped parts and rework parts. NOK, aborted or other parts are counted as rework. |
Availability losses [min:sec] |
Indicates the Availability losses separated into technical, organizational, changeover-related and quality losses. The total losses within the hour concerned is displayed for each category. However, planned downtimes are not counted. A downtime lasting multiple hours is split accordingly. |
Loss description |
For the two longest unplanned downtimes (Top1, Top2) that have started in the respective hour, the following can be displayed via the Downtime labeling drop-down list:
Additional downtimes (>2) can be accessed via the Additional column The Show planned downtimes checkbox can be used to control whether planned downtimes (only with comments) are also listed. However, these have no influence on the availability losses. |
S n. shift |
Totals for each shift of the target and actual quantities of the shift |
Daily total |
Totals for the entire production day |