The following interaction elements are available:
Element/icon |
Description |
|---|---|
Line selection |
|
|
Select a day in the calendar |
|
Display the previous or next day |
Relative date |
Display of the hourly quantity tracking for a relative date. When using the relative date, the display always contains the current values of the relative date (e.g. current day or yesterday) without explicitly specifying a date. The relative date is intended for the dashboard and similar displays to ensure that the current production day is always shown, even if the page remains open for an extended period of time (days). |
Downtime labeling |
Configure display in the Description of losses column |
Planned downtimes filter |
To additionally display or not display planned downtimes (only with comments) in the Description of losses column |
|
|
|
However, no downtime series or open-ended downtimes can be added. |
The following interaction elements are available:
Element/icon |
Description |
|
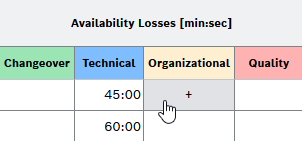
Add downtime. The Adding Downtime Dialog opens:
|
|
Add downtime to the corresponding category for the selected hour:
|
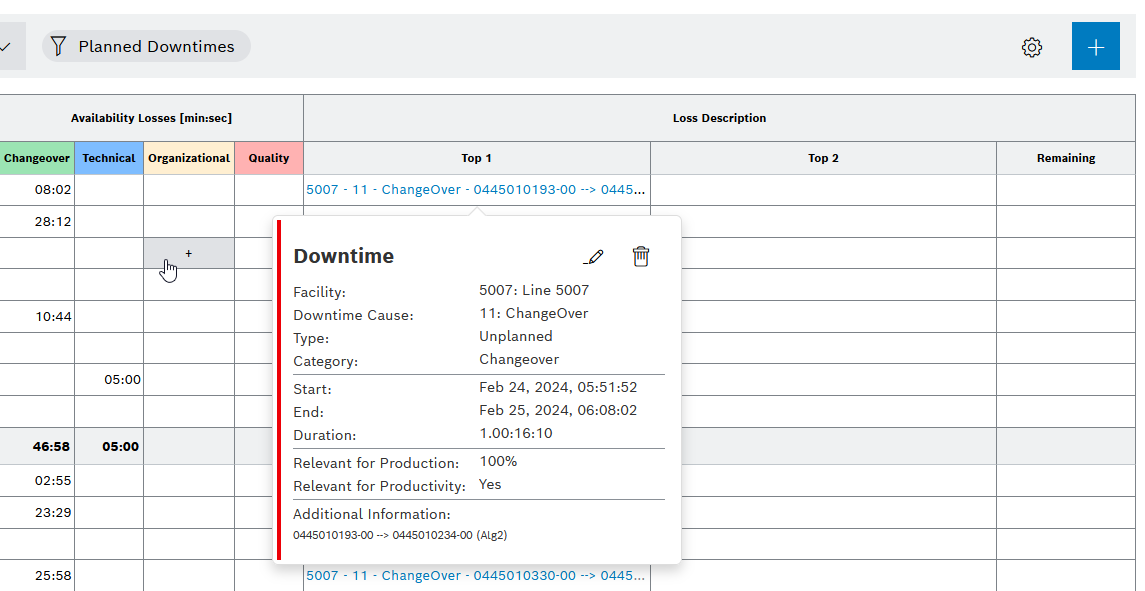
Click on a downtime description |
Viewing downtime details is displayed as a tooltip |
Click on a downtime description -> |
|
Click on a downtime description -> |
In the command bar, you can use Downtime labeling to specify which details are displayed in the Description of losses. The following elements are available for displaying downtimes:
Procedure
The selected details of the downtimes are displayed in the Description of losses columns.
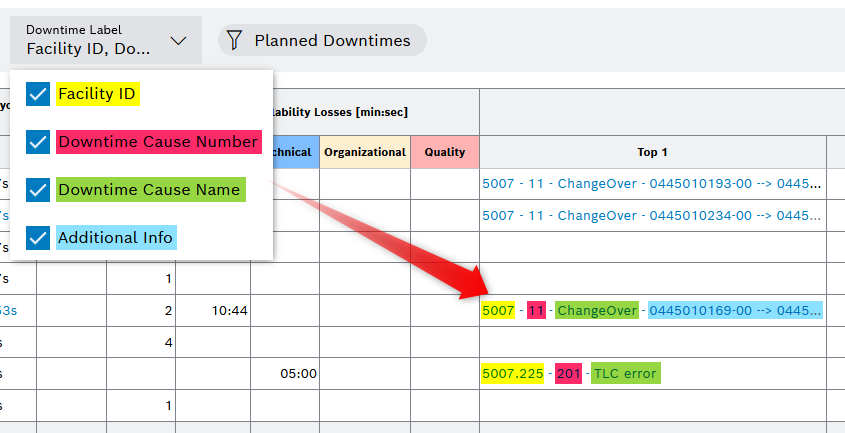
To illustrate the assignment, the elements are highlighted in color in the display
At least one element must be selected
The selected setting is saved in the URL