Domains are an extension to the standard tickets to define additional ticket properties. A domain is registered through the API with domain name and domain-specific ticket properties. This functionality can also be used by Nexeed modules to define additional information that is available in the ticket for tickets generated by the module.
If a domain is registered, tickets with domain-specific ticket properties can be created both in the background by other Nexeed modules and manually in the Task Tracking > Ticket Management menu item:
Create a Ticket Manually.
The domain-specific ticket properties can be changed at any time by the Domain without a reference to the Nexeed Ticket Management module via the API.
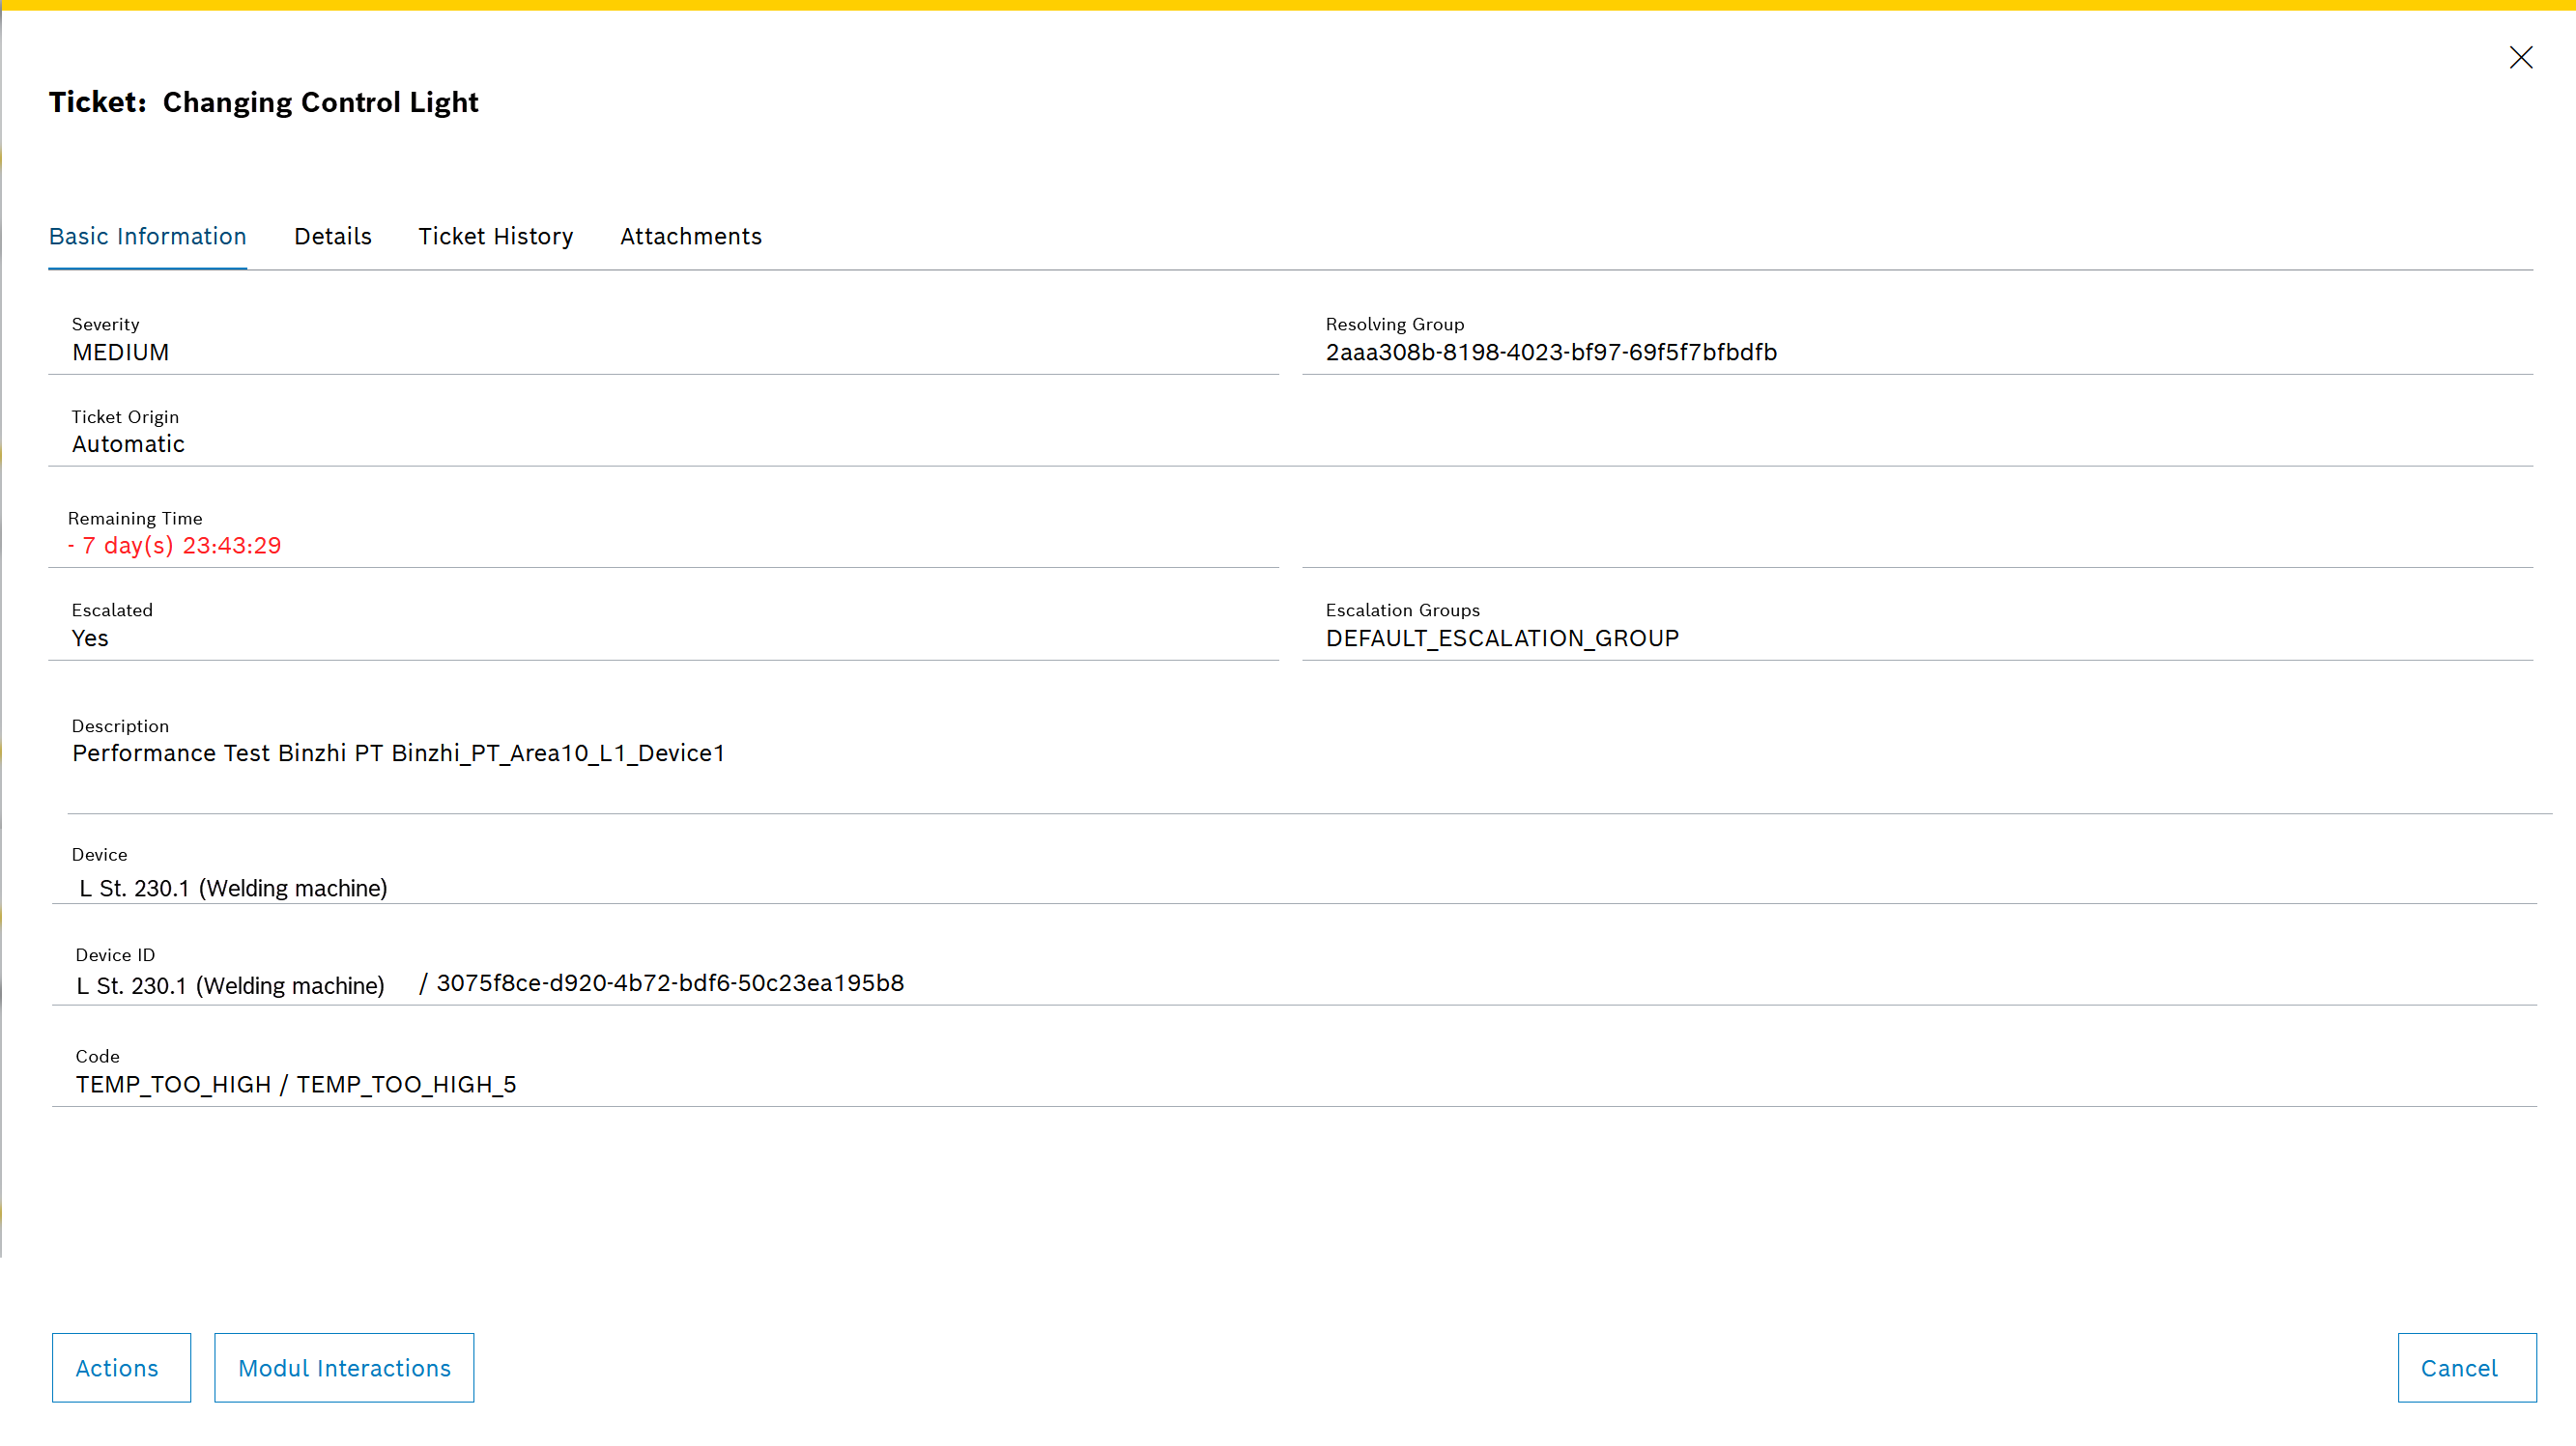
The domain-specific ticket properties are displayed in the ticket detailed view in the Basic Information tab below the description: Basic Information Tab.
The individual properties are displayed with the following information:
Example: Nexeed Condition Monitoring domains
The Nexeed Condition Monitoring module is registered as a domain by default.
The following additional ticket properties are defined:

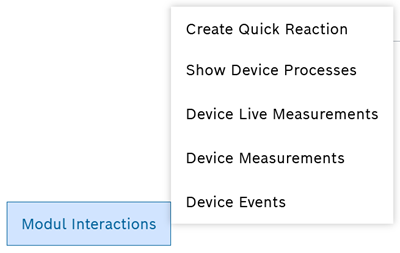
In addition to the domain-specific ticket properties, branch options are also implemented in the Nexeed Condition Monitoring module. These module interactions are different for manually created tickets from those for tickets created automatically in the background and are dependent on the device in both cases.
If other Nexeed modules have also registered interactions for a device in the Nexeed portal, these are also displayed as an option for module interactions.
Example options for Module interactions of the Nexeed Condition Monitoring: domain
Create a quick reaction in the Shopfloor Management > Deviation Processor menu:
Create or Edit Quick Reaction
View and validate the process details in the Process quality menu:
Reiter Prozesse.
View the relevant detailed information for the device in the Efficiency analysis > Condition monitoring menu:
Condition monitoring.

Device Measurement Analysis:
View the Measured value analysis tab in the Performance Analysis > Condition Monitoring menu. The display is filtered by Creation date and Code:
Measurements tab.
